Bull run or bull trap? Look for these clues [Video]
![Bull run or bull trap? Look for these clues [Video]](https://editorial.fxstreet.com/images/Markets/Equities/SP500/wall-street-sign-637299022550250958_XtraLarge.jpg)
Watch the video extracted from the WLGC session before the market open on 07 Nov 2023 below to find out the following:
-
The signal that confirmed the current rally
-
The likely pathway for the S&P 500 after this rally
-
The immediate target for the potential final push-up
-
The telltale signs of a bull run (or sneaky trap)
-
And a lot more...
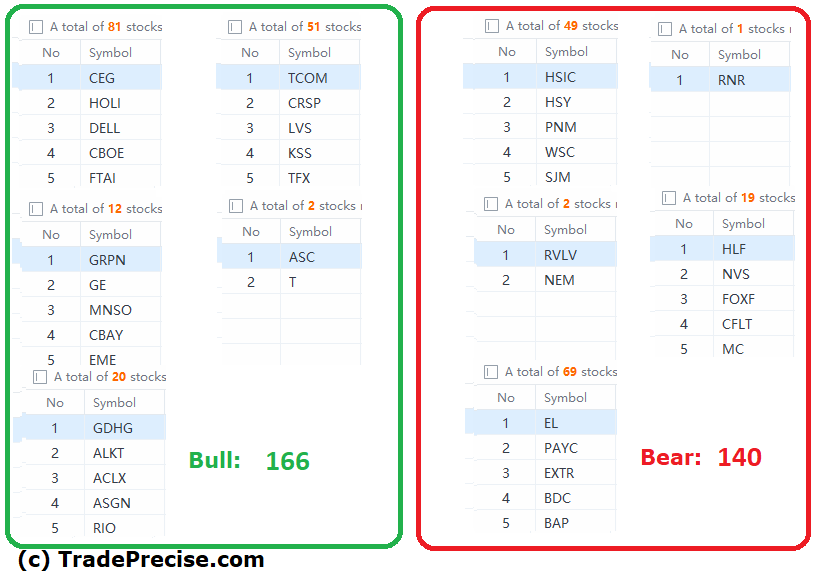
The bullish vs. bearish setup is 166 to 140 from the screenshot of my stock screener below pointing to a slightly positive market environment.
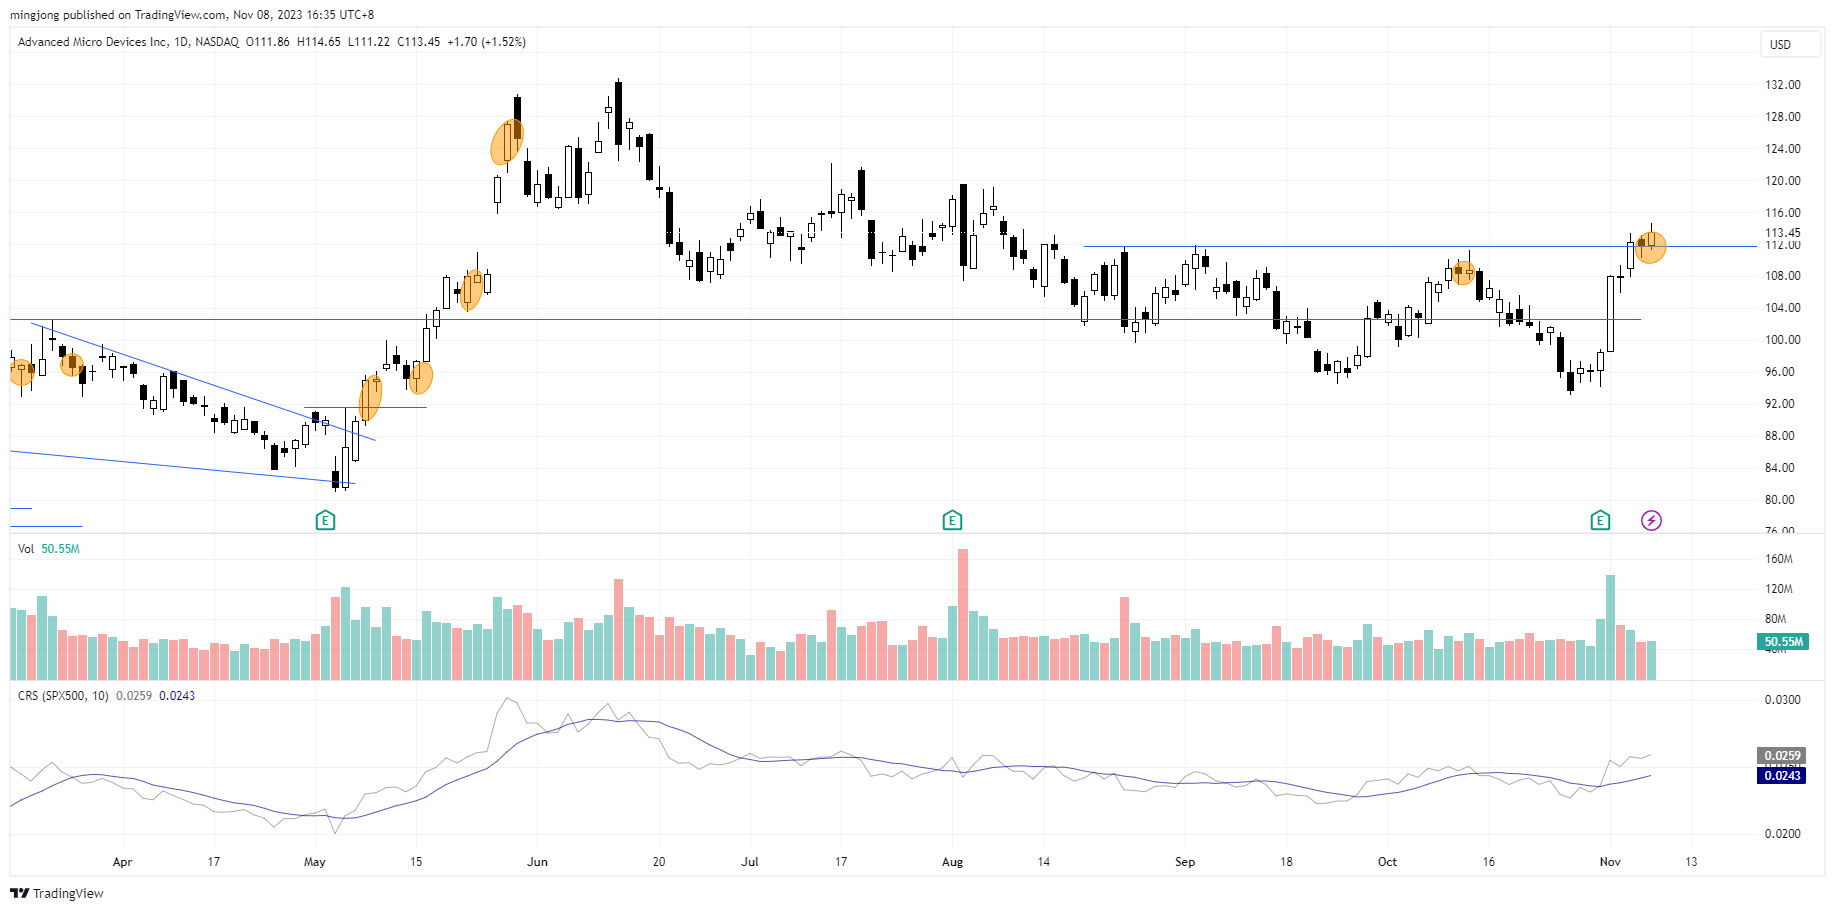
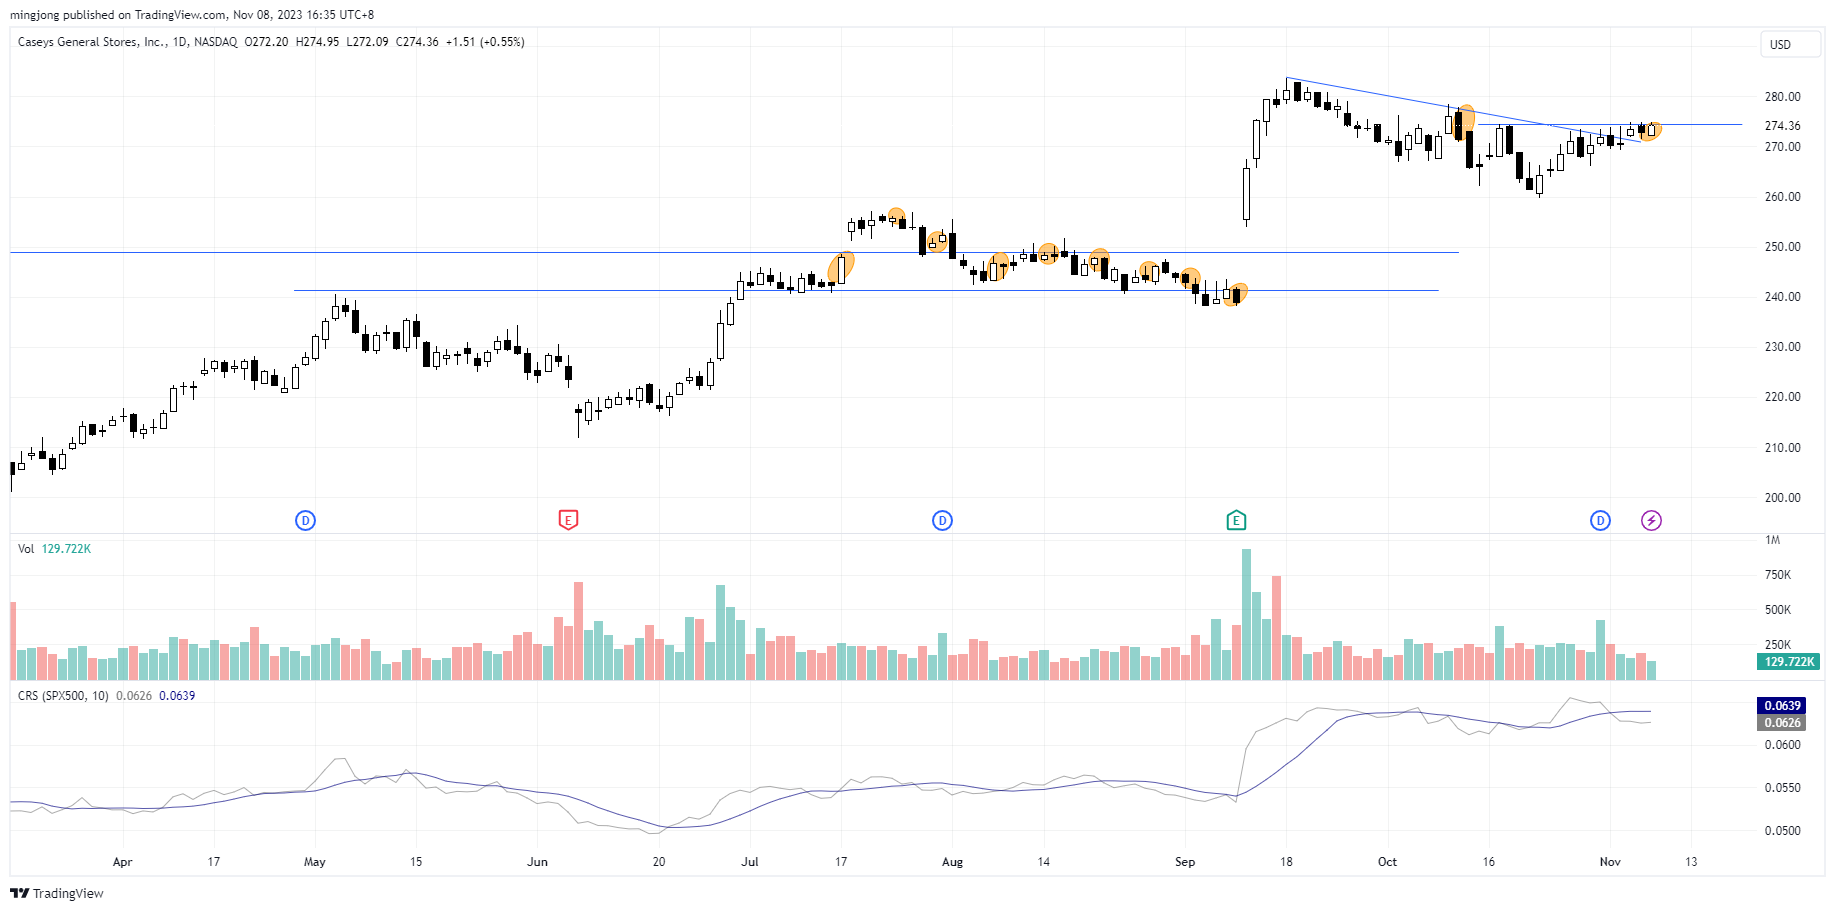
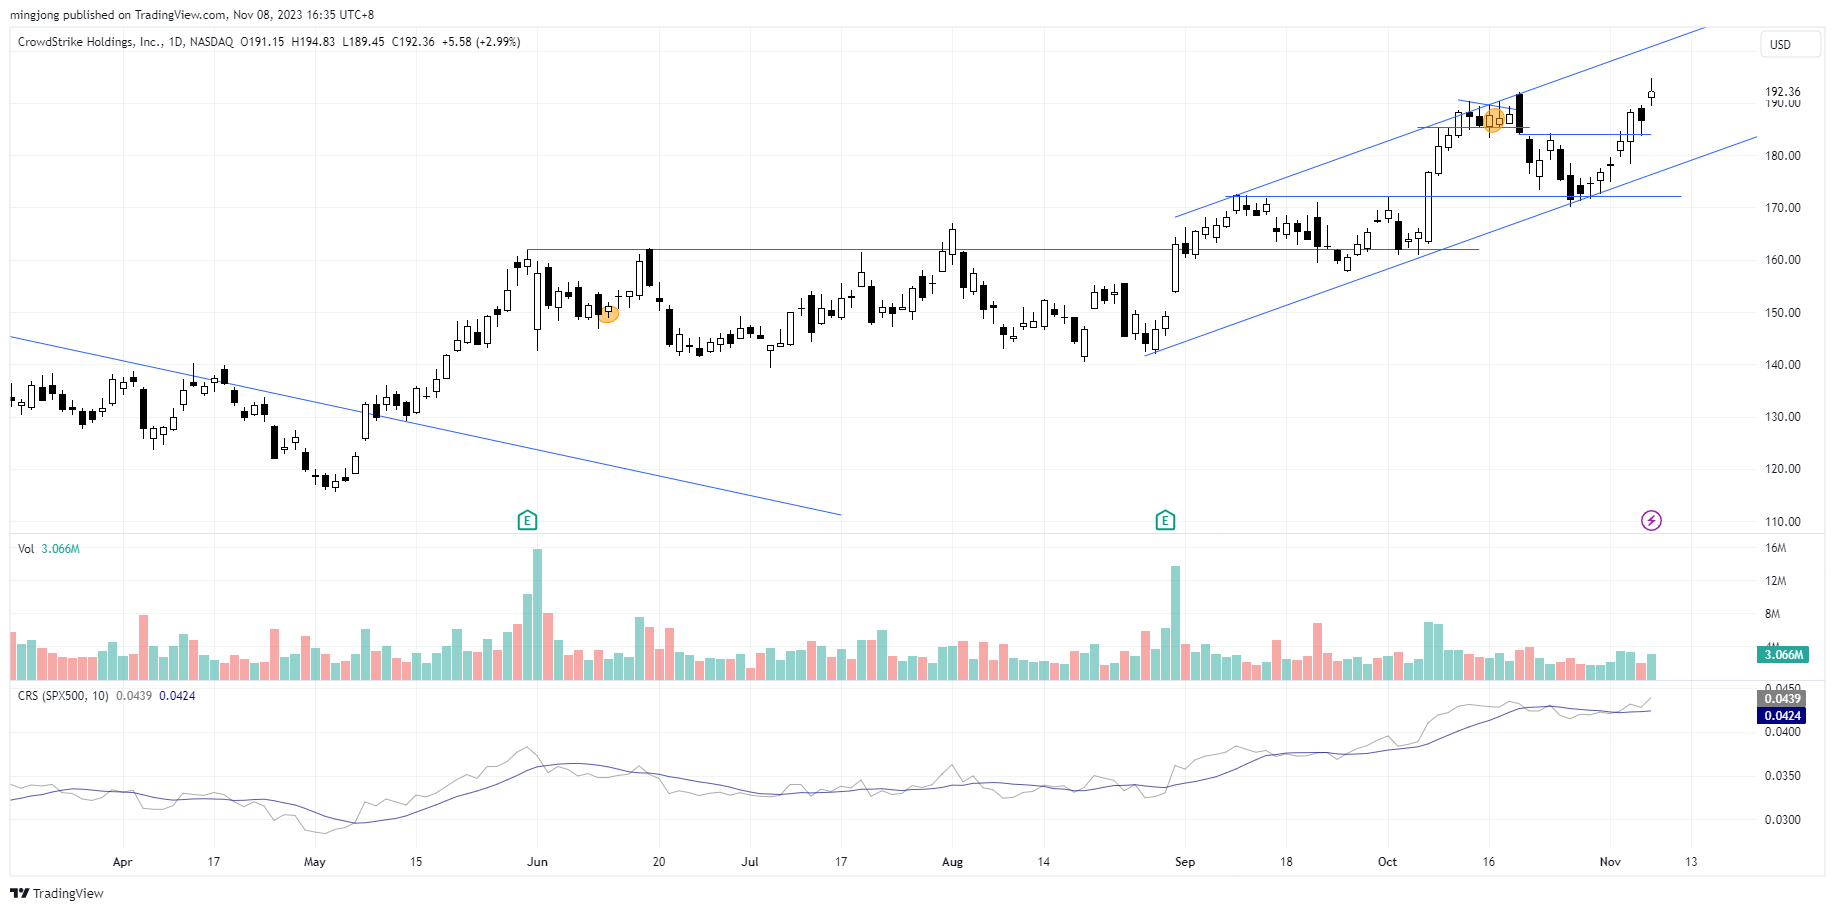
4 “low hanging fruits” (AMD, CASY, etc…) trade entries setup + 11 others (CRWD, etc…) plus 17 “wait and hold” candidates have been discussed during the live session before the market open (BMO).
Author

Ming Jong Tey
Independent Analyst
Ming Jong Tey has been trading since 2008. He started his learning journey from technical analysis (indicators, Fibonacci, etc...) to value investing. Throughout his journey, he develops an interest in price action with chart pattern trading.


