Britannia Industries Elliott Wave technical analysis [Video]
![Britannia Industries Elliott Wave technical analysis [Video]](https://editorial.fxstreet.com/images/TechnicalAnalysis/ChartPatterns/PointFigure/stock-market-data-18635784_XtraLarge.jpg)
BRITANNIA Elliott Wave technical analysis
Function: Larger Degree Trend Higher (Intermediate degree, orange).
Mode: Motive.
Structure: Impulse/Diagonal.
Position: Minute Wave ((iv)).
Details: Minute Wave ((iv)) Navy might be unfolding within Minor Wave 3 of Intermediate Wave (5) against 5950.
Invalidation point: 5730.
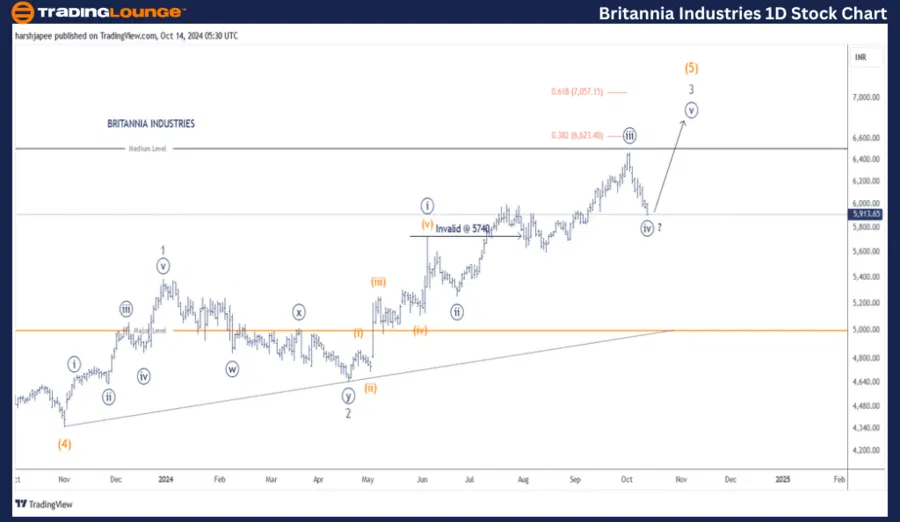
Britannia Industries daily chart technical analysis and potential Elliott Wave counts
Britannia Industries daily chart is indicating a progressive rally, which could be unfolding Minor Wave 3 Grey, within Intermediate Wave (5) Orange towards 7050 at least and up to 8000 levels going forward. The stock should ideally stay above 5730-40 range to keep the bullish structure intact.
Britannia Industries has been rallying since November 2023 after printing lows around 4300-50 range, terminating Intermediate Wave (4) Orange. Furthermore, Minor Waves 1 and 2 Grey seems to have terminated around 5170 and 4650 levels respectively.
Minor Wave 3 Grey has been unfolding against 4650 mark and is sub dividing within a potential impulse. Minute Waves ((i)) through ((iv)) might be complete and Minute Wave ((v)) might be underway higher soon. The stock should hold above 5740 mark for impulse to complete.
BRITANNIA Elliott Wave technical analysis
Function: Larger Degree Trend Higher (Intermediate degree, orange.)
Mode: Motive
Structure: Impulse/Diagonal
Position: Minute Wave ((iv))
Details: Minute Wave ((iv)) Navy might be unfolding or near to complete within Minor Wave 3 of Intermediate Wave (5) against 5730. If correct, Minute Wave ((v)) could resume higher towards 7060.
Invalidation point: 5730
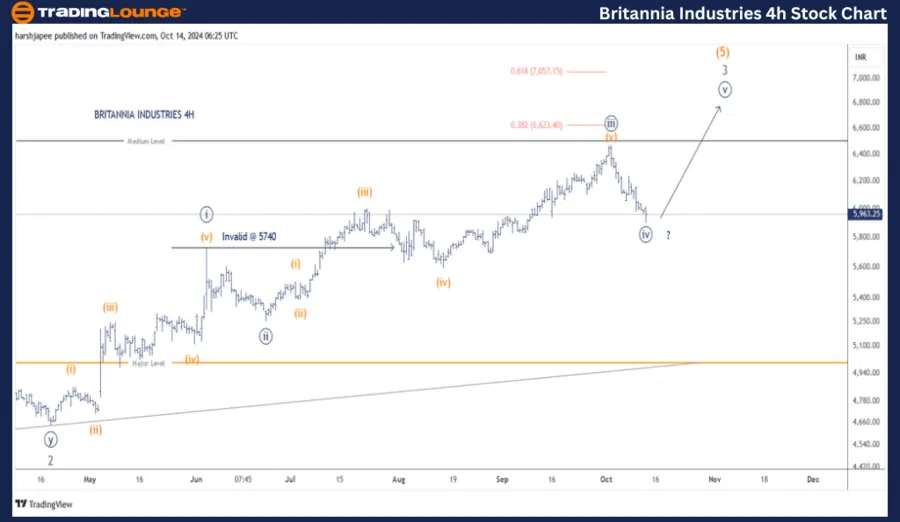
Britannia Industries four-hour chart technical analysis and potential Elliott Wave counts
Britannia Industries 4H chart is indicative of potential Minute Wave ((v)) Navy complete around 5910 mark at the time of writing. If correct, the stock should progress higher from here, as Minute Wave (v) of Minor Wave 3 resumes.
Conclusion
Britannia Industries could be ready to push higher from 5910 lows print on October 14, 2024; as minute Wave ((v)) of Minor Wave 3 Grey begin to unfold.
Britannia Industries Elliott Wave technical analysis [Video]
Author

Peter Mathers
TradingLounge
Peter Mathers started actively trading in 1982. He began his career at Hoei and Shoin, a Japanese futures trading company.


