BPCL Indian Stocks Elliott Wave technical analysis [Video]
![BPCL Indian Stocks Elliott Wave technical analysis [Video]](https://editorial.fxsstatic.com/images/i/General-Stocks_2_XtraLarge.png)
BPCL – BPCL (1D Chart) Elliott Wave Technical Analysis.
Elliott Wave technical analysis
-
Function: Counter Trend (Intermediate Degree Orange).
-
Mode: Corrective.
-
Structure: Potential Impulse within a Larger Degree Correction.
-
Position: Minute Wave ((v)).
-
Details:
-
The lower-degree impulse wave is potentially complete around 243.
-
Minute Wave ((v)) has unfolded as a diagonal.
-
If correct, a counter-trend rally should push above the 300 level soon.
-
-
Invalidation point: 375.
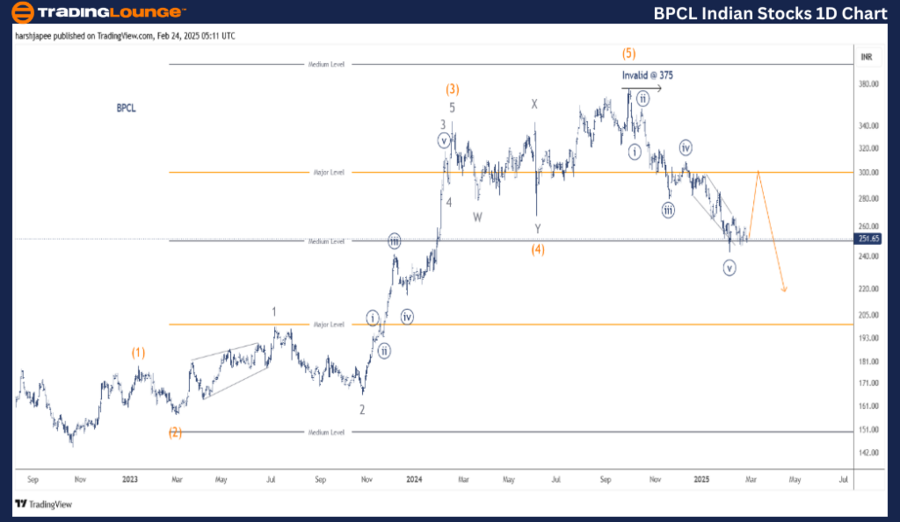
BPCL Daily Chart – Technical Analysis & Elliott Wave Counts.
The BPCL daily chart indicates a trend reversal after the stock declined from the 375 level in October 2024.
-
A potential impulse lower has been completed, suggesting a larger degree trend is turning bearish against the all-time high of 375.
-
Previously, the stock had formed a bottom in the 140-145 zone (October 2022).
-
From there, a five-wave rally at the Intermediate Degree (Waves (1) through (5)) led to a peak at 375 in October 2024.
-
Since then, bearish control has prevailed.
BPCL – BPCL (4H Chart) Elliott Wave Technical Analysis.
Elliott Wave technical analysis
-
Function: Counter Trend (Intermediate Degree Orange).
-
Mode: Corrective.
-
Structure: Potential Impulse within a Larger Degree Correction.
-
Position: Minute Wave ((v)).
-
Details:
-
The lower-degree impulse wave is potentially complete around 243.
-
Minute Wave ((v)) has unfolded as a diagonal.
-
If correct, a counter-trend rally should push above the 300 level soon.
-
-
Invalidation point: 375.
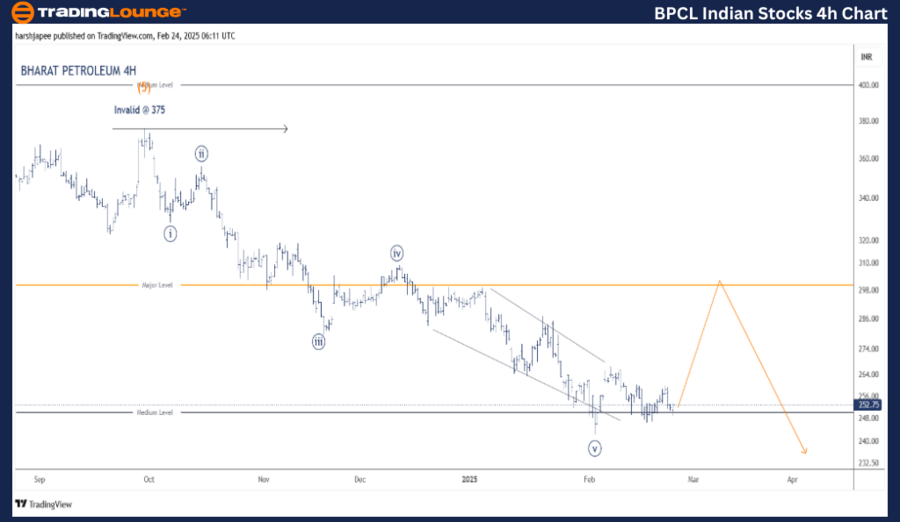
BPCL 4H Chart – Technical Analysis & Elliott Wave Counts.
The BPCL 4H chart highlights sub-waves after the stock hit 375 in October 2024.
-
The entire drop from 375 to 243 appears as an impulse at the Minute Degree.
-
Minute Wave ((v)) may have unfolded as an ending diagonal.
-
If correct, a corrective rally toward 306 is expected before bearish control resumes.
-
A deeper correction towards 144 may unfold in the coming months.
Conclusion
BPCL has turned lower against 375 and could enter a much deeper correction after a pullback rally.
-
Key Resistance: 300-310 range – watch for selling pressure in this zone.
Elliott Wave analyst: Harsh Japee.
Elliott Wave technical analysis [Video]
Author

Peter Mathers
TradingLounge
Peter Mathers started actively trading in 1982. He began his career at Hoei and Shoin, a Japanese futures trading company.


