Bovespa Index Elliott Wave technical analysis [Video]
![Bovespa Index Elliott Wave technical analysis [Video]](https://editorial.fxsstatic.com/images/i/Equity-Index_IBEX-2_XtraLarge.jpg)
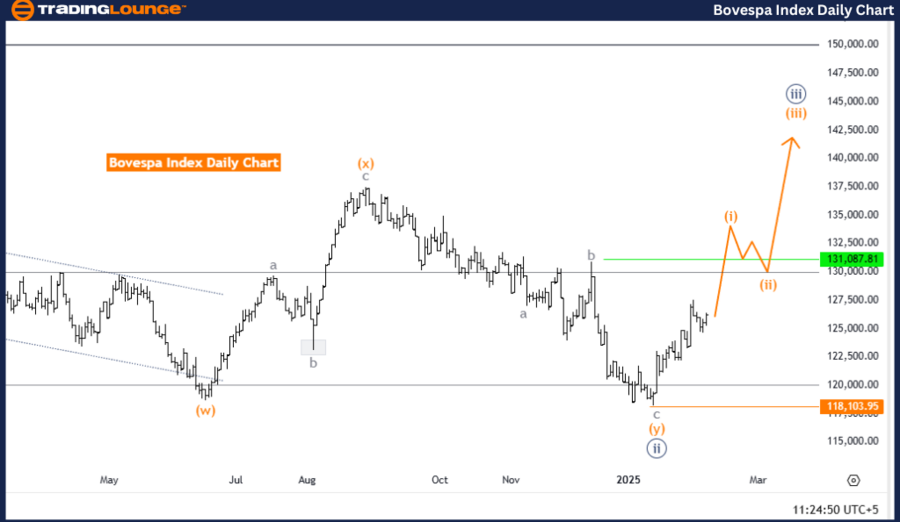
Bovespa Index Elliott Wave analysis trading lounge day chart.
Bovespa Index Elliott Wave Technical Analysis
-
Function: Bullish Trend.
-
Mode: Impulsive.
-
Structure: Orange Wave 1.
-
Position: Navy Blue Wave 3.
-
Direction next lower degrees: Orange Wave 2.
-
Details: Navy blue wave 2 appears complete; orange wave 1 of 3 is now developing.
-
Wave cancel invalidation level: 118,103.95.
The Bovespa Index daily chart analysis, based on Elliott Wave Theory, indicates a bullish trend currently unfolding in impulsive mode. The main focus is on orange wave 1 within navy blue wave 3, which has commenced following the completion of navy blue wave 2.
The successful completion of navy blue wave 2 suggests that the market has transitioned from a corrective phase to a fresh upward movement driven by orange wave 1. This wave often marks the beginning of a new bullish cycle, characterized by increased buying momentum and a gradual price rise.
As navy blue wave 3 progresses, the market is expected to sustain its bullish momentum, with orange wave 1 serving as the foundation for further upward moves. The wave cancel invalidation level is set at 118,103.95. A breach of this level would invalidate the current wave structure, requiring a reassessment of the market outlook.
The formation of orange wave 1 signals a potential continuation of the upward movement, possibly leading to higher impulsive waves in the near term. Traders should closely monitor market conditions to capitalize on bullish opportunities while staying alert for any deviations from the projected wave structure.
Conclusion
The Bovespa Index daily chart presents a bullish trend scenario led by the development of orange wave 1 within navy blue wave 3. The completion of navy blue wave 2 suggests renewed buying interest, with further price increases likely. Traders should observe price movements near the invalidation level to ensure accurate market analysis and make informed trading decisions.
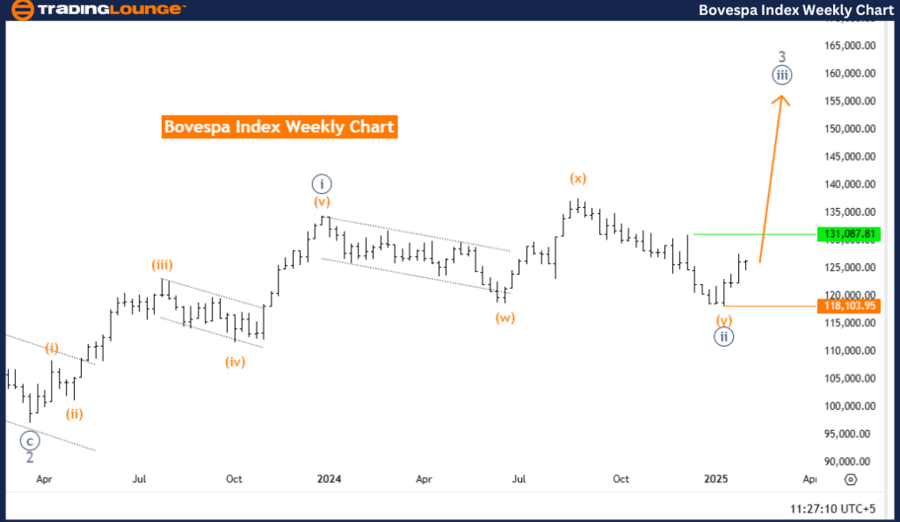
Bovespa Index Elliott Wave analysis trading lounge weekly chart
Bovespa Index Elliott Wave technical analysis
-
Function: Bullish Trend.
-
Mode: Impulsive.
-
Structure: Navy Blue Wave 3.
-
Position: Gray Wave 3.
-
Direction next higher degrees: Navy Blue Wave 3 (Started).
-
Details: Navy blue wave 2 appears complete; navy blue wave 3 is now in progress.
-
Wave cancel invalidation level: 118,103.95.
The Bovespa Index weekly chart analysis, based on Elliott Wave Theory, indicates a bullish trend in impulsive mode. The primary focus is on navy blue wave 3, which is currently developing after the completion of navy blue wave 2. This transition suggests the market has moved from a corrective phase into a stronger upward trend.
The completion of navy blue wave 2 signals renewed buying interest, setting the stage for the development of navy blue wave 3. Impulsive waves, like navy blue wave 3, typically bring strong upward momentum, characterized by higher highs and increased trading volume.
The position within gray wave 3 further supports the continuation of the bullish trend, as this wave often represents the middle phase of a major upward cycle. The market is expected to maintain positive momentum, with further price advances likely as navy blue wave 3 progresses.
The wave cancel invalidation level is set at 118,103.95. If the price falls below this level, the current wave structure would become invalid, requiring a reevaluation of the market outlook. Traders should monitor market conditions closely to confirm the bullish scenario and adjust their strategies accordingly.
Conclusion
The Bovespa Index weekly chart presents a bullish trend setup, led by the development of navy blue wave 3 within gray wave 3. The completion of navy blue wave 2 suggests a strong upward movement, creating potential trading opportunities in line with the market's bullish momentum. Close attention should be given to price action near the invalidation level to ensure an accurate market assessment and effective trading decisions.
Bovespa Index Elliott Wave technical analysis [Video]
Author

Peter Mathers
TradingLounge
Peter Mathers started actively trading in 1982. He began his career at Hoei and Shoin, a Japanese futures trading company.


