Bovespa Index Elliott Wave technical analysis [Video]
![Bovespa Index Elliott Wave technical analysis [Video]](https://editorial.fxstreet.com/images/Markets/Equities/Bovespa/bm-amp-f-75135517_XtraLarge.jpg)
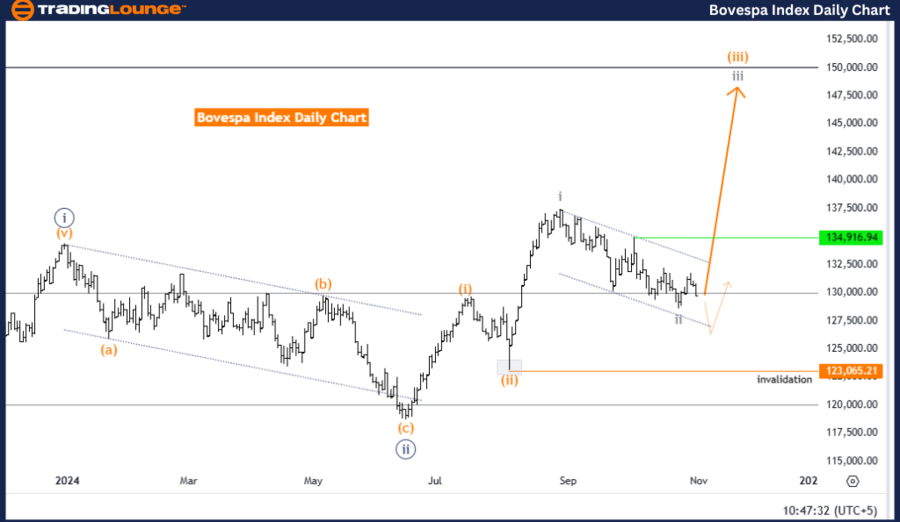
Bovespa Index Elliott Wave technical analysis
-
Function: Trend.
-
Mode: Impulsive.
-
Structure: Gray wave 3.
-
Position: Orange wave 3.
-
Direction of next higher degrees: Gray wave 3 (initiated).
-
Details: Gray wave 2 appears complete; gray wave 3 now underway.
-
Wave cancellation level: 123065.21.
The daily Elliott Wave analysis for the Bovespa Index indicates a trend-driven structure in an impulsive mode, with gray wave 3 actively progressing. Following the apparent completion of gray wave 2, the current position is within orange wave 3, signaling the start of a new advancing phase. This configuration suggests that the Bovespa Index is in the early stages of an upward movement aligned with the primary trend.
Gray wave 3, as described in this analysis, represents an impulsive phase typically following a corrective wave, here identified as gray wave 2. This structure implies strong directional momentum, as impulsive waves in Elliott Wave theory generally indicate substantial trend continuation. The ongoing progress of gray wave 3 points to further potential gains, as the wave structure remains intact without breaching critical invalidation levels.
The wave cancellation level at 123065.21 is a key threshold in this analysis. Should prices drop below this level, it would invalidate the current wave count and suggest that gray wave 3 may have either stalled or that the current interpretation needs review. Remaining above this level, however, supports the possibility of continued upward movement within the primary trend.
In summary, the Bovespa Index appears positioned in an advancing phase, with gray wave 3 now active following the completion of gray wave 2. Located within orange wave 3 of gray wave 3, the current setup aligns with the broader trend direction, reinforcing the likelihood of further gains. The wave cancellation level of 123065.21 is crucial for confirming the integrity of the wave structure and, consequently, the trend’s strength, marking it as an essential validation point in this Elliott Wave analysis.
Bovespa Index Elliott Wave technical analysis
-
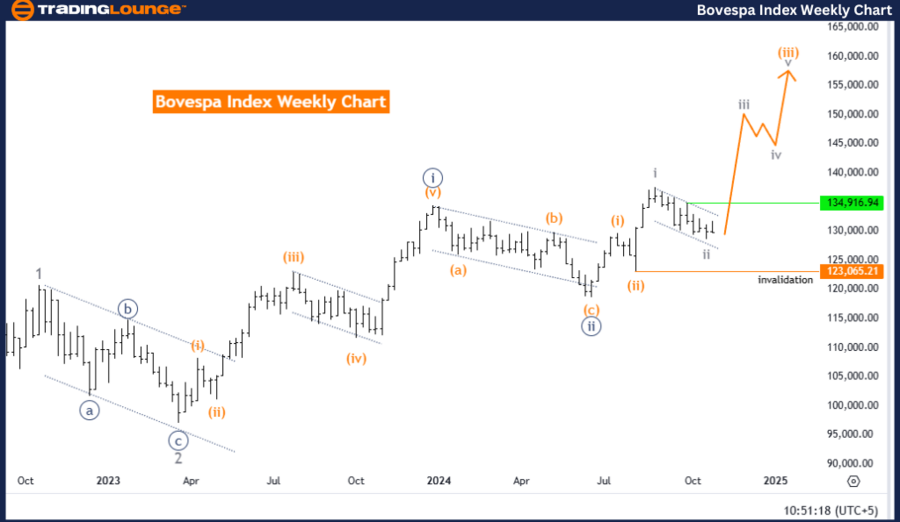
Function: Trend.
-
Mode: Impulsive.
-
Structure: Gray wave 3.
-
Position: Orange wave 3.
-
Direction of next higher degrees: Gray wave 3 (initiated).
-
Details: Gray wave 2 appears complete; gray wave 3 now active.
-
Wave cancellation level: 123065.21.
The weekly Elliott Wave analysis for the Bovespa Index indicates a trend-oriented, impulsive structure where gray wave 3 is progressing. With gray wave 2 considered complete, the current structure is unfolding in orange wave 3, implying that the index is experiencing a significant upward move within the trend. This setup suggests that the Bovespa Index is entering an advanced phase of a broader bullish cycle.
In Elliott Wave theory, impulsive waves like gray wave 3 typically demonstrate strong directional momentum and sustained movement in the trend’s direction. The completion of gray wave 2, generally a corrective wave, sets the stage for an uptrend continuation through gray wave 3. With orange wave 3 active within gray wave 3, the current configuration signals potential for further upward price movement, aligning with the higher-degree trend.
The wave cancellation level at 123065.21 is crucial in this analysis, serving as an invalidation point for the current wave count. Should the index move below this level, it would suggest that the gray wave 3 setup might not hold, potentially requiring a reassessment of the wave structure and trend outlook. Remaining above this level, however, supports the current wave structure, enhancing the probability of sustained upward momentum.
In summary, the Bovespa Index shows strong alignment with the trend within gray wave 3, following the completion of gray wave 2. Positioned within orange wave 3, the current structure suggests continued upside potential. The wave cancellation threshold at 123065.21 is essential for confirming the validity of this bullish wave count, marking it as a critical level to validate the ongoing trend.
Bovespa Index Elliott Wave technical analysis [Video]
Author

Peter Mathers
TradingLounge
Peter Mathers started actively trading in 1982. He began his career at Hoei and Shoin, a Japanese futures trading company.


