Bovespa Index Elliott Wave technical analysis [Video]
![Bovespa Index Elliott Wave technical analysis [Video]](https://editorial.fxstreet.com/images/Markets/Equities/Bovespa/bm-amp-f-75135517_XtraLarge.jpg)
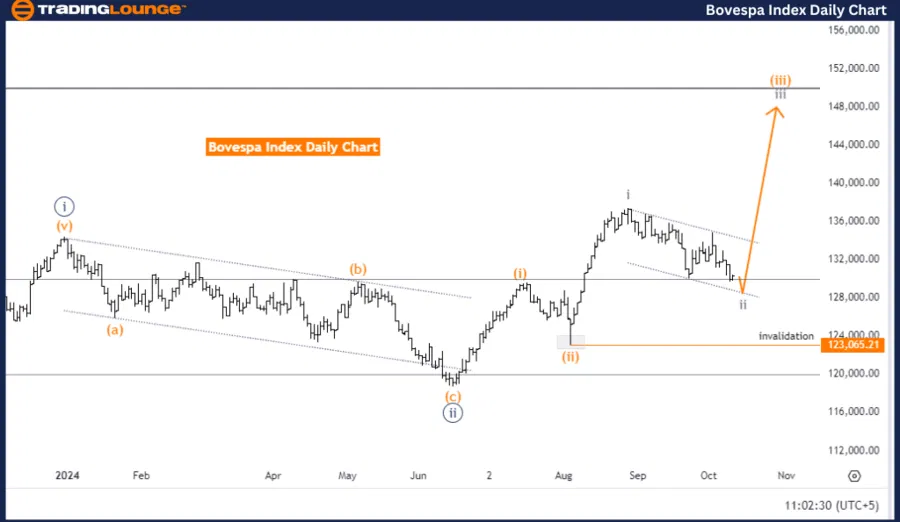
Bovespa Index Elliott Wave Analysis – Trading Lounge day chart.
Bovespa Index Elliott Wave technical analysis
-
Function: Counter Trend.
-
Mode: Corrective.
-
Structure: Gray wave 2.
-
Position: Orange wave 3.
-
Direction (next higher degrees): Gray wave 3.
-
Details: Gray wave 1 appears completed; gray wave 2 is currently unfolding and nearing its conclusion.
-
Wave cancel invalidation level: 123065.21.
Summary
The Elliott Wave analysis of the Bovespa Index on the daily chart points to a counter-trend in a corrective mode. The structure is presently in gray wave 2, following the completion of gray wave 1. The index is positioned within orange wave 3, signaling that the market may be close to completing the corrective phase before resuming its upward trend.
The next expected movement aligns with gray wave 3, indicating that once gray wave 2 concludes, the market could continue its bullish trajectory. As gray wave 1 has already been completed, gray wave 2 is currently active and appears to be approaching its end. This implies that the corrective phase is almost over, with the market potentially poised for a bullish move as gray wave 3 begins.
The current corrective wave (gray wave 2) has led to some consolidation or pullback, and the market now seems prepared for the next impulsive phase, likely an extension of the upward trend seen in orange wave 3. The wave cancel or invalidation level is set at 123065.21. If the index drops below this level, the current wave count would be invalidated.
In conclusion, the Bovespa Index is in a corrective phase, with gray wave 2 nearing its completion. Once gray wave 2 finishes, gray wave 3 is expected to start, potentially resuming the upward momentum seen in orange wave 3. The market is currently consolidating but is anticipated to transition into an impulsive move as the corrective wave ends. The wave count remains valid as long as the index stays above the invalidation level of 123065.21.
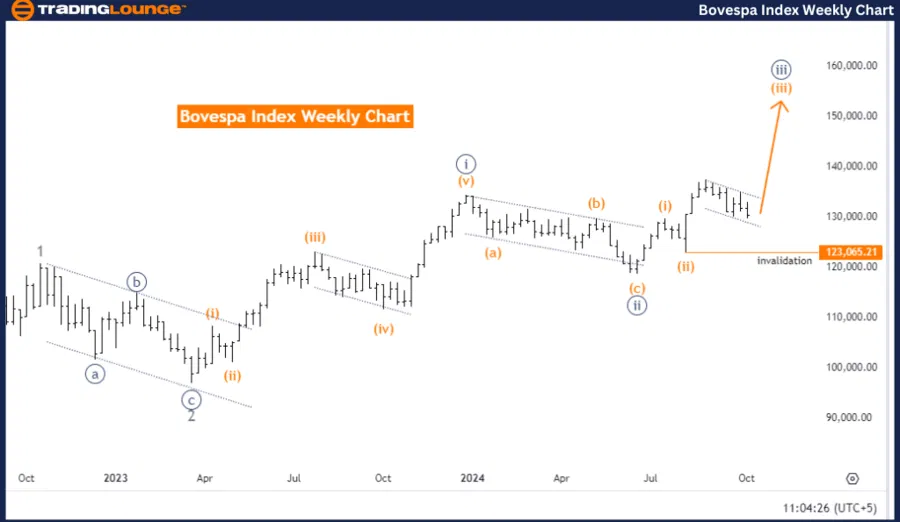
Bovespa Index Elliott Wave Analysis – Trading Lounge weekly chart
Bovespa Index Elliott Wave technical analysis
-
Function: Trend.
-
Mode: Impulsive.
-
Structure: Orange wave 3.
-
Position: Navy blue wave 3.
-
Direction (next lower degrees): Orange wave 4.
-
Details: Orange wave 2 has completed; orange wave 3 is currently unfolding.
-
Wave cancel invalidation level: 123065.21.
Summary
The Elliott Wave analysis of the Bovespa Index on the weekly chart indicates a strong upward trend in an impulsive mode. The current wave structure is in orange wave 3, which follows the completion of orange wave 2. The index is positioned within navy blue wave 3, suggesting the continuation of the upward trend.
As orange wave 3 progresses, the next lower degree of movement, orange wave 4, could signal a corrective phase once the current impulsive wave peaks. The details confirm that orange wave 2 has completed, and orange wave 3 is now unfolding, driving a bullish momentum.
The market is in the midst of an impulsive phase, with potential for further gains as orange wave 3 continues to push the index higher. Once orange wave 3 reaches its peak, a correction (orange wave 4) may occur before the market resumes its upward trend.
The wave cancel or invalidation level is set at 123065.21. If the index falls below this level, the current wave count would be invalidated, indicating a shift in market direction. However, as long as the index stays above this invalidation level, the bullish Elliott Wave count remains intact.
In conclusion, the Bovespa Index is currently experiencing an impulsive upward move driven by orange wave 3. The market is expected to continue rising before eventually entering a corrective phase in orange wave 4. The current trend remains valid as long as the index remains above the invalidation level of 123065.21.
Bovespa Index Elliott Wave technical analysis [Video]
Author

Peter Mathers
TradingLounge
Peter Mathers started actively trading in 1982. He began his career at Hoei and Shoin, a Japanese futures trading company.


