Bovespa Index Elliott Wave technical analysis
Function: Counter trend.
Mode: Corrective.
Structure: Orange wave 2.
Position: Navy blue wave 3.
Direction next higher degrees: Orange wave 3.
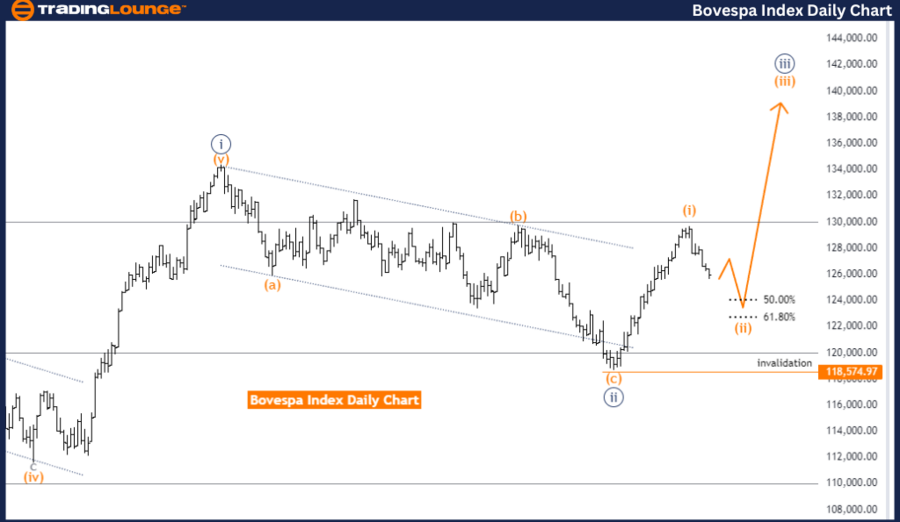
The Bovespa Index Elliott Wave Analysis on the daily chart indicates the market is currently in a counter-trend phase, characterized as corrective. The focus is on Orange Wave 2, positioned within Navy Blue Wave 3. This suggests the market is undergoing the second corrective wave within a larger third wave, often part of a larger trend.
The analysis suggests the next higher degree of movement will be Orange Wave 3. After the completion of the ongoing corrective phase (Orange Wave 2), the market is expected to transition into Orange Wave 3, typically associated with a strong impulsive move in line with the overall trend.
Notably, Orange Wave 1 appears complete, and Orange Wave 2 of 3 is now in play. This indicates the market has finished the initial impulsive wave (Orange Wave 1) and entered the corrective phase (Orange Wave 2) within the larger impulsive wave (Navy Blue Wave 3). The completion of Wave 1 suggests a new market direction has been established, and the current Wave 2 is a temporary pullback before the trend resumes in Wave 3.
The wave cancellation invalid level is set at 118574.97. This level is crucial as it serves as a validation point for the current wave structure. If the market price drops below this level, it would invalidate the current wave analysis, indicating that the expected wave pattern is no longer applicable, and a revision of the analysis would be necessary.
In summary, the Bovespa Index daily chart analysis shows the market is in a counter-trend corrective phase within Orange Wave 2, positioned in Navy Blue Wave 3. The market has completed Orange Wave 1 and is now in the corrective phase of Orange Wave 2. Following this phase, the market is expected to transition into Orange Wave 3, continuing the primary trend. The wave cancel invalid level is 118574.97, serving as a critical threshold for the validation of the current wave analysis.
Bovespa Index Elliott Wave weekly chart
Function: Trend.
Mode: Impulsive
Structure: Navy blue wave 3.
Position: Gray wave 3.
Direction next lower degrees: Navy blue wave 4.
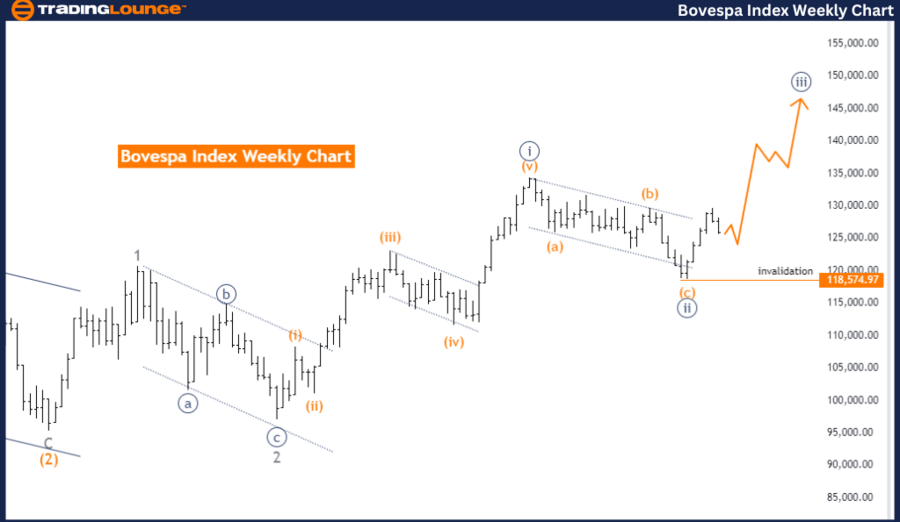
The Bovespa Index Elliott Wave Analysis on the weekly chart indicates the market is currently in a trend phase, characterized as impulsive. The wave structure being analyzed is Navy Blue Wave 3, positioned within Gray Wave 3. This suggests the market is undergoing the third wave of a larger third wave, typically representing a strong and extended move in the direction of the trend.
The analysis points out that the next lower degree of movement will be Navy Blue Wave 4. After the completion of the ongoing impulsive phase (Navy Blue Wave 3), the market is expected to enter Navy Blue Wave 4, typically a corrective phase following an impulsive wave.
A significant detail in this analysis is that Navy Blue Wave 2 is considered complete, and Navy Blue Wave 3 of 3 is now in play. This indicates the market has finished the second corrective wave (Navy Blue Wave 2) and has entered the third impulsive wave (Navy Blue Wave 3) within the larger impulsive wave (Gray Wave 3). The completion of Wave 2 suggests the market has resumed its primary trend, and the current Wave 3 is expected to be a strong continuation of this trend.
The wave cancellation invalid level is set at 118574.97. This level is crucial as it serves as a validation point for the current wave structure. If the market price drops below this level, it would invalidate the current wave analysis, indicating the expected wave pattern is no longer applicable, necessitating a revision of the analysis.
In summary, the Bovespa Index weekly chart analysis shows the market is in an impulsive trend phase within Navy Blue Wave 3, positioned in Gray Wave 3. The market has completed Navy Blue Wave 2 and is now in the impulsive phase of Navy Blue Wave 3. Following this phase, the market is expected to enter Navy Blue Wave 4, a corrective phase. The wave cancel invalid level is 118574.97, serving as a critical threshold for the validation of the current wave analysis.
Bovespa Index Elliott Wave technical analysis [Video]
As with any investment opportunity there is a risk of making losses on investments that Trading Lounge expresses opinions on.
Historical results are no guarantee of future returns. Some investments are inherently riskier than others. At worst, you could lose your entire investment. TradingLounge™ uses a range of technical analysis tools, software and basic fundamental analysis as well as economic forecasts aimed at minimizing the potential for loss.
The advice we provide through our TradingLounge™ websites and our TradingLounge™ Membership has been prepared without considering your objectives, financial situation or needs. Reliance on such advice, information or data is at your own risk. The decision to trade and the method of trading is for you alone to decide. This information is of a general nature only, so you should, before acting upon any of the information or advice provided by us, consider the appropriateness of the advice considering your own objectives, financial situation or needs. Therefore, you should consult your financial advisor or accountant to determine whether trading in securities and derivatives products is appropriate for you considering your financial circumstances.
Recommended content
Editors’ Picks
AUD/USD defends bid above 0.6550 amid renewed Mid-East tensions

AUD/USD is holding recovery gains above 0.6550 in the Asian session on Monday. The US Dollar slips amid increased Fed rate cut bets and a firmer risk tone while the Aussie weighs escalating Middle East tensions ahead of an action-packed week.
USD/JPY remains pressured around 154.50 as hawkish BoJ bets offset risk-flows

USD/JPY stays under pressure around 154.50 early Monday, as heightened odds of a BoJ rate hike this week offset Middle East worries and a broad US Dollar softness. All eyes remain on the BoJ and Fed policy announcements, which are due later this week.
Gold price trades with mild positive bias; lacks bullish conviction amid risk-on mood

Gold price once again showed some resilience below the 50-day SMA on Friday and staged a modest recovery from the vicinity of over a two-week low touched the previous day. The move up followed the release of the US Personal Consumption Expenditures Price Index.
Crypto weekly flashback and best trades for the week

Meme coins showed mixed results in the past week. Dogecoin, Shiba Inu and Pepe started their recovery early on Sunday while Dogwifhat and Bonk extend losses.
Investors hoping for a better week

Global markets will try their best to get into a better mood after contending with a tough wave of risk off flow in the previous week. Key standouts on Monday’s calendar come from UK consumer credit, mortgage approvals, and CBI trades, along with Dallas Fed manufacturing.