Bovespa Index Elliott Wave technical analysis [Video]
![Bovespa Index Elliott Wave technical analysis [Video]](https://editorial.fxstreet.com/images/Markets/Equities/Bovespa/bm-amp-f-75135517_XtraLarge.jpg)
Bovespa Index Elliott Wave technical analysis
Function: Counter Trend.
Mode: Corrective.
Structure: Orange Wave 2.
Position: Navy Blue Wave 3.
Direction next higher degrees: Orange Wave 3.
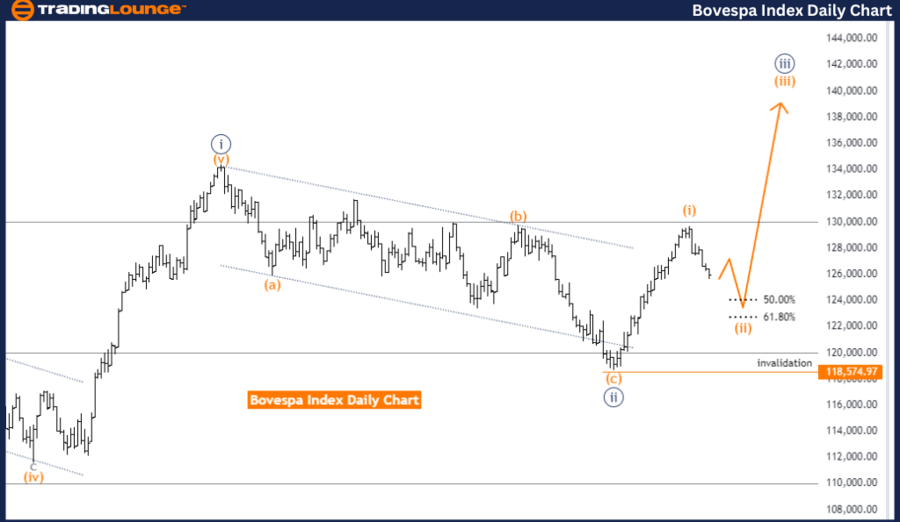
The Bovespa Index Elliott Wave Analysis on the daily chart indicates the market is currently in a counter-trend phase, characterized as corrective. The focus is on Orange Wave 2, positioned within Navy Blue Wave 3. This suggests the market is undergoing the second corrective wave within a larger third wave, often part of a larger trend.
The analysis suggests the next higher degree of movement will be Orange Wave 3. After the completion of the ongoing corrective phase (Orange Wave 2), the market is expected to transition into Orange Wave 3, typically associated with a strong impulsive move in line with the overall trend.
Notably, Orange Wave 1 appears complete, and Orange Wave 2 of 3 is now in play. This indicates the market has finished the initial impulsive wave (Orange Wave 1) and entered the corrective phase (Orange Wave 2) within the larger impulsive wave (Navy Blue Wave 3). The completion of Wave 1 suggests a new market direction has been established, and the current Wave 2 is a temporary pullback before the trend resumes in Wave 3.
The wave cancellation invalid level is set at 118574.97. This level is crucial as it serves as a validation point for the current wave structure. If the market price drops below this level, it would invalidate the current wave analysis, indicating that the expected wave pattern is no longer applicable, and a revision of the analysis would be necessary.
In summary, the Bovespa Index daily chart analysis shows the market is in a counter-trend corrective phase within Orange Wave 2, positioned in Navy Blue Wave 3. The market has completed Orange Wave 1 and is now in the corrective phase of Orange Wave 2. Following this phase, the market is expected to transition into Orange Wave 3, continuing the primary trend. The wave cancel invalid level is 118574.97, serving as a critical threshold for the validation of the current wave analysis.
Bovespa Index Elliott Wave weekly chart
Function: Trend.
Mode: Impulsive.
Structure: Navy Blue Wave 3.
Position: Gray Wave 3.
Direction next lower degrees: Navy Blue Wave 4.
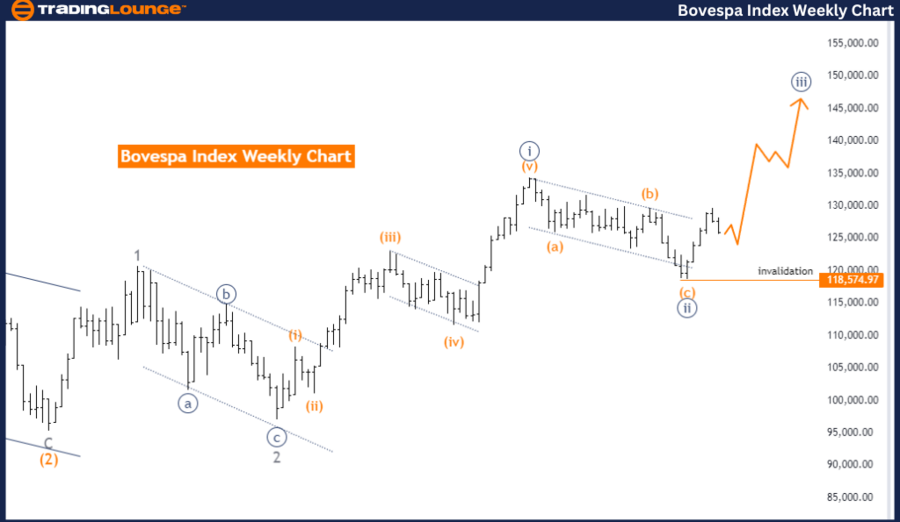
The Bovespa Index Elliott Wave Analysis on the weekly chart indicates the market is currently in a trend phase, characterized as impulsive. The wave structure being analyzed is Navy Blue Wave 3, positioned within Gray Wave 3. This suggests the market is undergoing the third wave of a larger third wave, typically representing a strong and extended move in the direction of the trend.
The analysis points out that the next lower degree of movement will be Navy Blue Wave 4. After the completion of the ongoing impulsive phase (Navy Blue Wave 3), the market is expected to enter Navy Blue Wave 4, typically a corrective phase following an impulsive wave.
A significant detail in this analysis is that Navy Blue Wave 2 is considered complete, and Navy Blue Wave 3 of 3 is now in play. This indicates the market has finished the second corrective wave (Navy Blue Wave 2) and has entered the third impulsive wave (Navy Blue Wave 3) within the larger impulsive wave (Gray Wave 3). The completion of Wave 2 suggests the market has resumed its primary trend, and the current Wave 3 is expected to be a strong continuation of this trend.
The wave cancellation invalid level is set at 118574.97. This level is crucial as it serves as a validation point for the current wave structure. If the market price drops below this level, it would invalidate the current wave analysis, indicating the expected wave pattern is no longer applicable, necessitating a revision of the analysis.
In summary, the Bovespa Index weekly chart analysis shows the market is in an impulsive trend phase within Navy Blue Wave 3, positioned in Gray Wave 3. The market has completed Navy Blue Wave 2 and is now in the impulsive phase of Navy Blue Wave 3. Following this phase, the market is expected to enter Navy Blue Wave 4, a corrective phase. The wave cancel invalid level is 118574.97, serving as a critical threshold for the validation of the current wave analysis.
Bovespa Index Elliott Wave technical analysis [Video]
Author

Peter Mathers
TradingLounge
Peter Mathers started actively trading in 1982. He began his career at Hoei and Shoin, a Japanese futures trading company.


