Bovespa Elliott Wave technical analysis [Video]
![Bovespa Elliott Wave technical analysis [Video]](https://editorial.fxstreet.com/images/Markets/Equities/DAX/dax-euro-concept-47253534_XtraLarge.jpg)
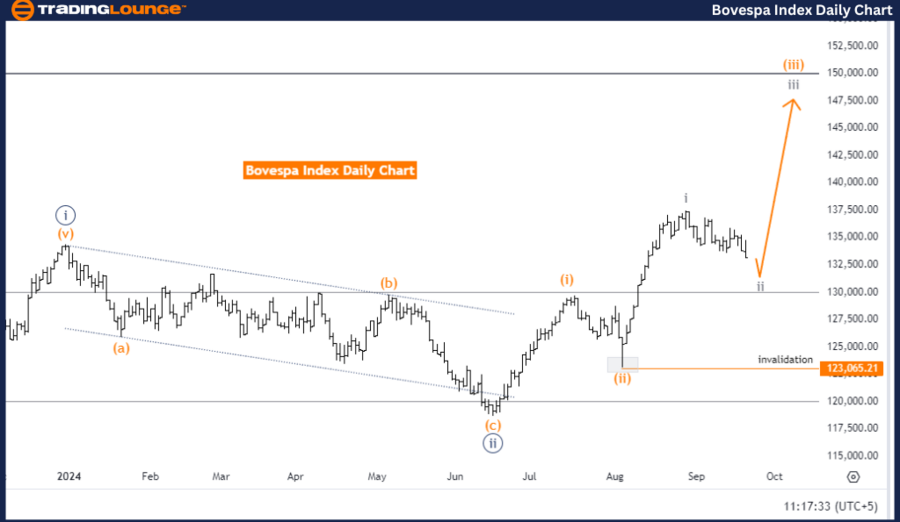
Bovespa Index Elliott Wave Analysis - Trading Lounge Day Chart
Bovespa index Elliott Wave technical analysis
-
Function: Counter Trend.
-
Mode: Corrective.
-
Structure: Gray Wave 2.
-
Position: Orange Wave 3.
-
Direction next higher degrees: Gray Wave 3.
-
Details: Gray wave 1 appears to have completed, and now gray wave 2 is currently in play.
-
Wave cancel invalid level: 123065.21.
The Elliott Wave analysis for the daily chart of the Bovespa Index indicates that the market is presently in a counter-trend movement. This implies that the price is moving against the larger prevailing trend. The analysis mode is corrective, suggesting the market is undergoing a temporary retracement before continuing its primary trend.
The wave structure under review is gray wave 2, part of the corrective phase. The market is currently positioned in orange wave 3, signaling that, once the corrective phase concludes, an upward move is anticipated. The next significant wave movement points toward gray wave 3, expected to be an impulsive upward movement following the completion of gray wave 2.
Further details show that gray wave 1 has already been completed, with gray wave 2 currently in progress. This indicates the market is experiencing a pullback after the upward movement in wave 1. The invalidation level for this wave count is set at 123065.21. If the price falls below this level, the current analysis becomes invalid and will require revision.
Conclusion:
The Bovespa Index is in a corrective phase within gray wave 2 after the completion of gray wave 1. The market is expected to resume its upward trajectory once the correction ends, leading into orange wave 3 and eventually gray wave 3. This analysis remains valid as long as the price remains above 123065.21.
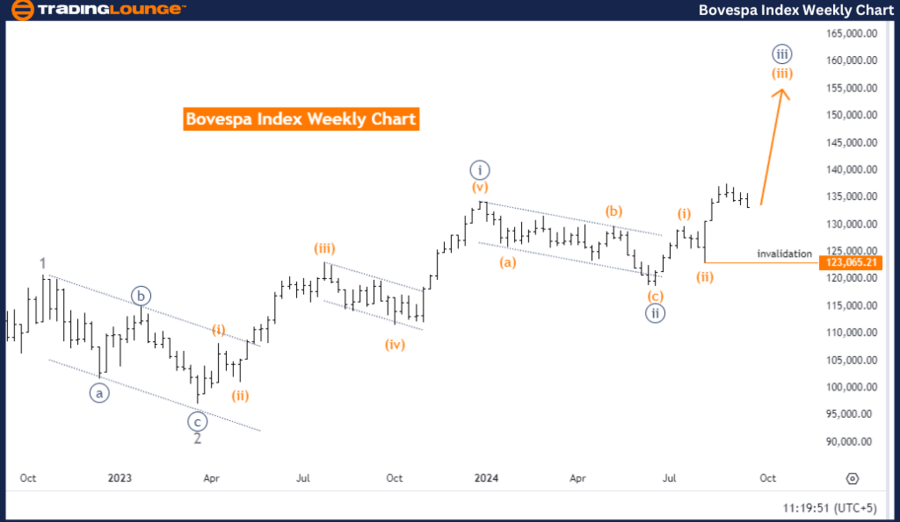
Bovespa Index Elliott Wave Analysis - Trading Lounge Weekly Chart
Bovespa index Elliott Wave technical analysis
-
Function: Bullish Trend.
-
Mode: Impulsive.
-
Structure: Orange Wave 3.
-
Position: Navy Blue Wave 3.
-
Direction next higher degrees: Orange Wave 3 (Started).
-
Details: Orange wave 2 appears to have been completed, and now orange wave 3 is in progress.
-
Wave cancel invalid level: 123065.21.
The Elliott Wave analysis for the weekly chart of the Bovespa Index reveals that the current market is in a bullish trend, indicating an upward direction. The analysis is in impulsive mode, meaning that the market is moving strongly in line with the main trend, showcasing momentum. The primary structure under analysis is orange wave 3, which is part of this larger bullish movement.
Currently, the market is positioned in navy blue wave 3, which falls within the broader structure of orange wave 3. This confirms that the market is in an upward phase, continuing its impulsive advance. The analysis indicates that orange wave 3 has already begun and is actively unfolding, pointing to continued upward potential.
The analysis further details that orange wave 2 has concluded, meaning the corrective phase has ended. The market has now entered orange wave 3, which represents a strong upward move aligned with the ongoing bullish trend. The invalidation level for this wave is set at 123065.21. If the price dips below this level, the current wave structure will become invalid and require revision.
Summary:
The Bovespa Index is in a bullish trend, with orange wave 3 currently in progress following the completion of orange wave 2. The market is expected to continue its upward momentum, advancing further through navy blue wave 3. This analysis remains valid as long as the price stays above 123065.21, supporting the continuation of the bullish phase.
Technical analyst: Malik Awais.
Bovespa index Elliott Wave technical analysis [Video]
Author

Peter Mathers
TradingLounge
Peter Mathers started actively trading in 1982. He began his career at Hoei and Shoin, a Japanese futures trading company.


