Bovespa Elliott Wave technical analysis [Video]
![Bovespa Elliott Wave technical analysis [Video]](https://editorial.fxstreet.com/images/Markets/Equities/close-up-of-stock-certificate-7978488_XtraLarge.jpg)
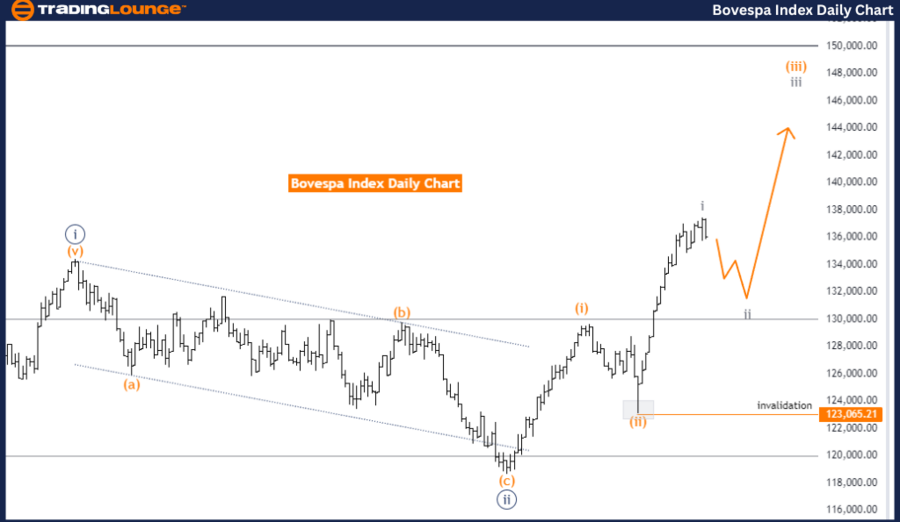
Bovespa Index Elliott Wave Analysis Trading Lounge Day Chart.
Bovespa Index Elliott Wave technical analysis
-
Function: Counter Trend.
-
Mode: Corrective.
-
Structure: Gray Wave 2.
-
Position: Orange Wave 3.
-
Direction next higher degrees: Gray Wave 3.
Details: Gray Wave 1 appears completed, with Gray Wave 2 currently in progress. Wave Cancel Invalidation Level: 123065.21.
The Bovespa Index is presently experiencing a counter-trend phase, as indicated by the Elliott Wave analysis on the daily chart. This phase reflects a corrective mode, generally a temporary move against the prevailing broader trend. The primary structure identified is Gray Wave 2, suggesting the market is in a corrective phase following the conclusion of the previous wave.
In this analysis, Gray Wave 1 seems to have completed its formation, with the market now transitioning into Gray Wave 2. This wave represents a corrective movement within the larger trend, indicating a potential pause or retracement before the onset of the next impulsive wave. The current market position lies within Orange Wave 3, part of the ongoing corrective structure.
The next higher degree direction is anticipated to be driven by Gray Wave 3, which will follow the completion of Gray Wave 2. This implies that once the current corrective phase concludes, the market might enter an impulsive phase again as Gray Wave 3 begins. This wave is expected to continue the broader market trend.
In summary, the Bovespa Index is in a counter-trend phase on the daily chart, marked by the completion of Gray Wave 1 and the transition into Gray Wave 2. The market is currently positioned within Orange Wave 3, part of the corrective phase. The analysis indicates that the market is gearing up for the next phase, which will be Gray Wave 3. This analysis remains valid as long as the price does not breach the wave cancel invalidation level of 123065.21.
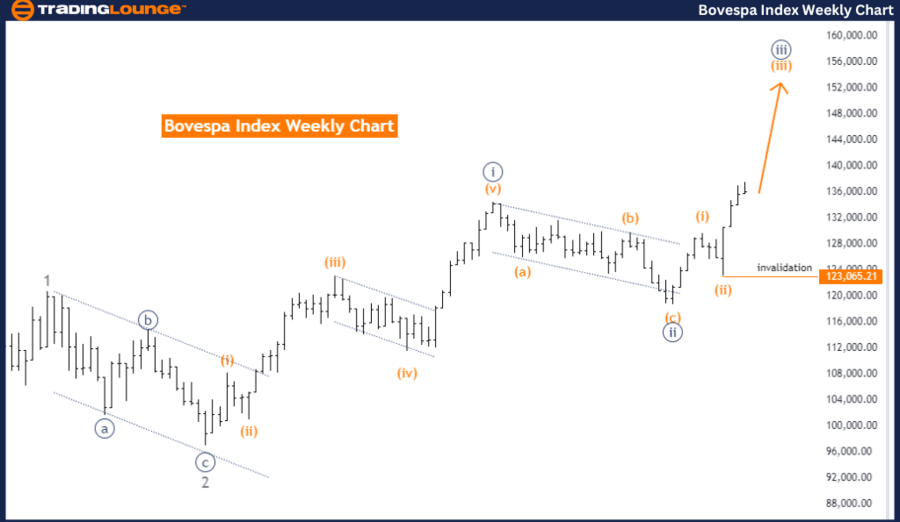
Bovespa Index Elliott Wave Analysis Trading Lounge Weekly Chart
Bovespa Index Elliott Wave technical analysis
-
Function: Bullish Trend.
-
Mode: Impulsive.
-
Structure: Orange Wave 3.
-
Position: Navy Blue Wave 3.
-
Direction next higher degrees: Orange Wave 3 (Continue).
Details: Orange Wave 2 appears completed, with Orange Wave 3 of 3 currently in progress. Wave Cancel Invalidation Level: 123065.21.
The Bovespa Index is currently following a bullish trend, according to the Elliott Wave analysis on the weekly chart. The market is in an impulsive mode, indicating a strong upward movement that aligns with the overall trend. The primary structure identified is Orange Wave 3, which signifies an ongoing impulsive wave within the broader bullish trend.
The analysis indicates that Orange Wave 2 seems to have completed its formation. This completion suggests the corrective phase has ended, and the market has now transitioned into Orange Wave 3, part of the impulsive structure. This wave is expected to continue driving the market upward, reinforcing the bullish trend.
The current market position lies within Navy Blue Wave 3, which is part of the larger Orange Wave 3 structure. This placement suggests the market is amidst an extended upward movement as part of the ongoing impulsive phase. The direction for the next higher degrees remains focused on the continuation of Orange Wave 3, indicating further bullish momentum in the upcoming periods.
In summary, the Bovespa Index is in a strong bullish trend on the weekly chart, marked by the completion of Orange Wave 2 and the progression into Orange Wave 3 of 3. The current market position is within Navy Blue Wave 3, signaling an ongoing impulsive move within the broader upward trend. The analysis suggests that the market is expected to continue its bullish momentum as Orange Wave 3 advances. The analysis remains valid as long as the price does not exceed the wave cancel invalidation level of 123065.21.
Technical analyst: Malik Awais.
Bovespa Index Elliott Wave technical analysis [Video]
Author

Peter Mathers
TradingLounge
Peter Mathers started actively trading in 1982. He began his career at Hoei and Shoin, a Japanese futures trading company.


