SQ2 Elliott Wave technical analysis
Greetings, Our Elliott Wave analysis today updates the Australian Stock Exchange (ASX) with BLOCK INC. – SQ2. We see SQ2.ASX having a slight decline with wave 4, and after it ends wave 5 will continue to come back to push higher.
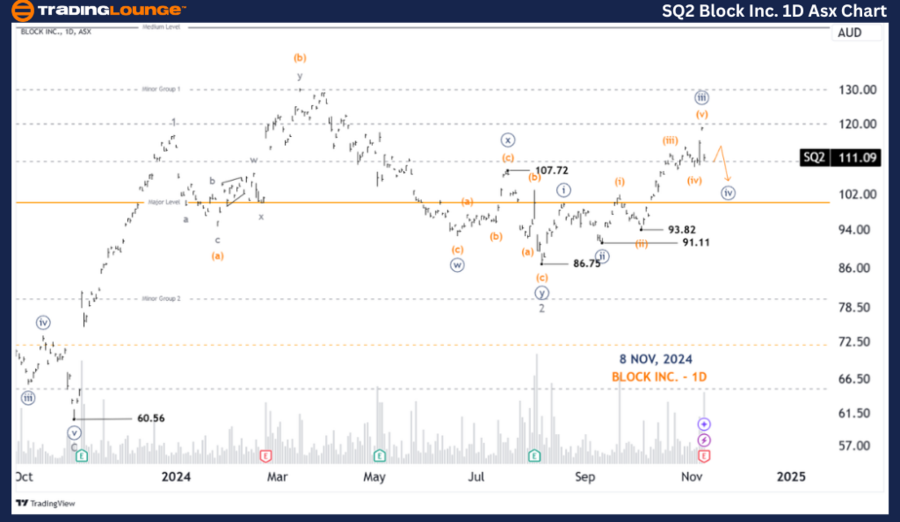
SQ2 one-day chart analysis
Function: Major trend (Minor degree, gray).
Mode: Motive.
Structure: Impulse.
Position: Wave ((iv))-navy of Wave 3-grey.
Details: Wave ((iii))-navy has ended, and wave ((iv))-navy is unfolding to push slightly lower, after which wave ((v))-navy could return to push higher.
Invalidation point: 100.00.
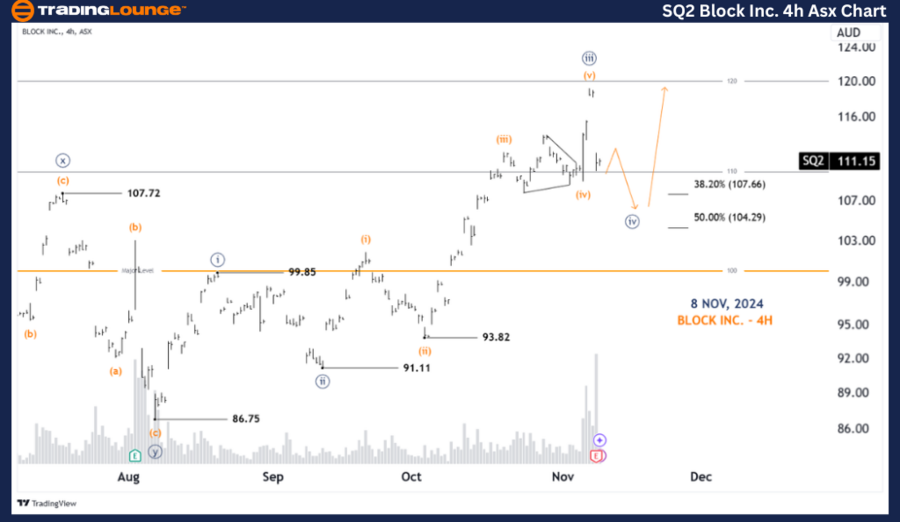
SQ2 four-hour chart analysis
Function: Major trend (Minute degree, navy).
Mode: Motive.
Structure: Impulse.
Position: Wave ((iv))-navy of Wave 3-grey.
Details: Wave ((iii))-navy has completed as a five-wave labeled from wave (i) to wave (v)-orange. Now wave ((iv))-navy is unfolding to push lower, targeting targets around 107.66 - 104.29, after which wave ((v))-navy could return to push higher. While price must remain above 99.85 to maintain this view.
Invalidation point: 99.85.
Conclusion
Our analysis, forecast of contextual trends, and short-term outlook for ASX: BLOCK INC. – SQ2 aim to provide readers with insights into the current market trends and how to capitalize on them effectively. We offer specific price points that act as validation or invalidation signals for our wave count, enhancing the confidence in our perspective. By combining these factors, we strive to offer readers the most objective and professional perspective on market trends.
Block Inc. Elliott Wave technical forecast [Video]
As with any investment opportunity there is a risk of making losses on investments that Trading Lounge expresses opinions on.
Historical results are no guarantee of future returns. Some investments are inherently riskier than others. At worst, you could lose your entire investment. TradingLounge™ uses a range of technical analysis tools, software and basic fundamental analysis as well as economic forecasts aimed at minimizing the potential for loss.
The advice we provide through our TradingLounge™ websites and our TradingLounge™ Membership has been prepared without considering your objectives, financial situation or needs. Reliance on such advice, information or data is at your own risk. The decision to trade and the method of trading is for you alone to decide. This information is of a general nature only, so you should, before acting upon any of the information or advice provided by us, consider the appropriateness of the advice considering your own objectives, financial situation or needs. Therefore, you should consult your financial advisor or accountant to determine whether trading in securities and derivatives products is appropriate for you considering your financial circumstances.
Recommended content
Editors’ Picks
EUR/USD retargets 1.0500 on extra Dollar weakness
The selling pressure around the US Dollar picks up pace and lifts EUR/USD to the area of two-day peaks near the 1.0480 level amid declining US and German yields.
Gold clings to daily gains near $2,940
Gold prices maintain their bullish stance near recent all-time highs above $2,950 per ounce troy amid the US Dollar's sell-off, shrinking US yields across the curve, and persistent tariff concerns and geopolitical woes.
GBP/USD climbs to two-month tops near 1.2650
GBP/USD now accelerates its daily recovery, leaving behind two daily pullbacks in a row and advancing to the 1.2650 region, or freshtwo-month highs, in response to the increasing selling bias in the Greenback.
Bitcoin consolidation continues as market prepares for the next major move
Bitcoin has been consolidating between $94,000 and $100,000 since February 5. Glassnode reports weakening capital inflows and declining derivatives activity, with short-term holder accumulation resembling challenging market conditions.
Money market outlook 2025: Trends and dynamics in the Eurozone, US, and UK
We delve into the world of money market funds. Distinct dynamics are at play in the US, eurozone, and UK. In the US, repo rates are more attractive, and bills are expected to appreciate. It's also worth noting that the Fed might cut rates more than anticipated, similar to the UK. In the eurozone, unsecured rates remain elevated.
The Best brokers to trade EUR/USD
SPONSORED Discover the top brokers for trading EUR/USD in 2025. Our list features brokers with competitive spreads, fast execution, and powerful platforms. Whether you're a beginner or an expert, find the right partner to navigate the dynamic Forex market.