BHARTI AIRTEL – BHARTIARTL Elliott Wave technical analysis [Video]
![BHARTI AIRTEL – BHARTIARTL Elliott Wave technical analysis [Video]](https://editorial.fxstreet.com/images/Markets/Equities/Industries/Insurance/pic-signing-contract-637435374858445846_XtraLarge.jpg)
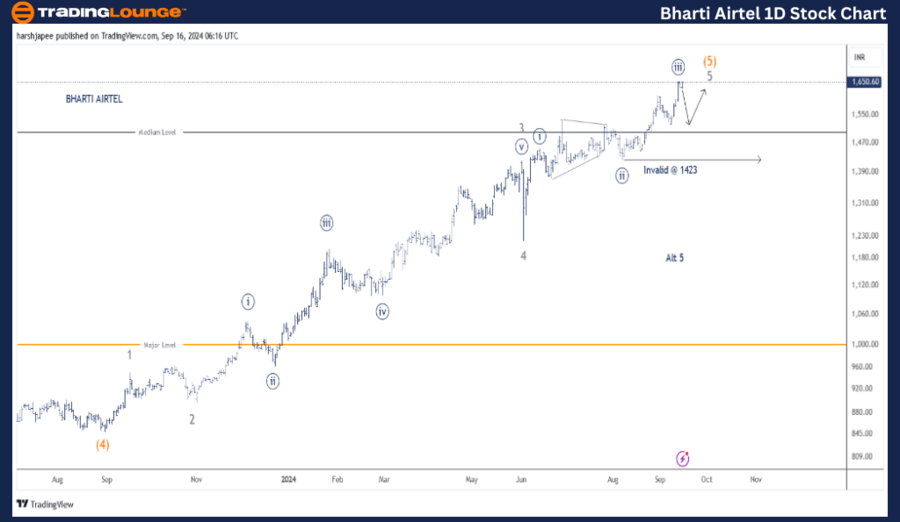
BHARTI AIRTEL – BHARTIARTL (1D Chart) Elliott Wave technical analysis
Function: Larger Degree Trend Higher (Intermediate degree, orange).
Mode: Motive.
Structure: Impulse.
Position: Minute Wave ((iii)) Navy.
Details: Minute Wave ((iii)) Navy looks complete around 1650-55 range. If correct, expect a corrective Wave ((iv)) Navy before the next leg up. Alternatively, Wave 5 Grey of Intermediate (5) is now complete.
Invalidation point: 1423.
Bharti Airtel Daily Chart Technical Analysis and potential Elliott Wave Counts:
Bharti Airtel daily chart has registered a fresh high around 1600-50 on September 13, 2024. It could be Minute Wave ((iii)) Navy complete as bears look to drag prices lower near-term. Watch out for support around 1500-50 range before the final push higher.
Bharti Airtel has been in a religious uptrend since August 2023 after hitting lows around 850 mark, terminating Intermediate Wave (4) Orange. Minor Wave 4 terminated around 1225 on June 04, 2024 and Minor Wave 5 is progressing since then.
Furthermore, the stock may pullback in the near term towards 1500-50 range before attempting another high above 1650 to complete Minor Wave 5 Grey. Alternatively, Minor Wave 5 is complete around the recent high (1600-50) and prices should resume lower soon.
BHARTI AIRTEL – BHARTIARTL (4H chart) Elliott Wave/technical analysis
Function: Larger Degree Trend Higher (Intermediate degree, orange).
Mode: Motive.
Structure: Impulse.
Position: Minute Wave ((iii)) Navy.
Details: Minute Wave ((iii)) Navy of Minor Wave 5 Grey looks complete around 1650-55 range. If correct, expect a corrective Wave ((iv)) Navy before the next leg up.
Alternatively, Wave 5 Grey of Intermediate (5) is now complete.
Invalidation point: 1423.
Bharti Airtel 4H Chart Technical Analysis and potential Elliott Wave Counts:
Bharti Airtel 4H chart highlights the sub waves within Minor Wave 5 Grey. Minute Wave ((ii)) produced a potential triangle while Wave ((iii)) looks complete around 1650. If correct, bears should be back in control in the near term to carve Minute Wave ((iv)).
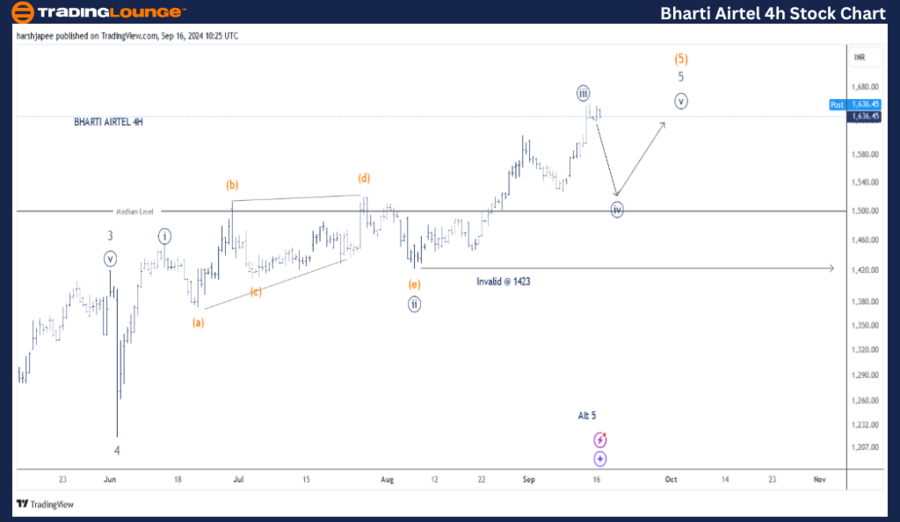
Conclusion
Bharti Airtel cold slip lower to carve Minute Wave ((iv)) Navy towards 1500-50 before resuming higher gain towards 1650 as bulls prepare a final push.
Elliott Wave analyst: Harsh Japee.
BHARTI AIRTEL – BHARTIARTL Elliott Wave technical analysis [Video]
Author

Peter Mathers
TradingLounge
Peter Mathers started actively trading in 1982. He began his career at Hoei and Shoin, a Japanese futures trading company.


