BHARAT Electronics Ltd – BEL Indian stocks Elliott Wave technical analysis [Video]
![BHARAT Electronics Ltd – BEL Indian stocks Elliott Wave technical analysis [Video]](https://editorial.fxstreet.com/images/Markets/Equities/Industries/Software/pic-laptop-screen-637435355891636339_XtraLarge.jpg)
BHARAT Electronics Ltd – BEL (1D chart) Elliott Wave technical analysis
Function: Larger Degree Trend Higher (Intermediate degree, orange).
Mode: Motive.
Structure: Impulse.
Position: Minute Wave ((ii)) Navy.
Details: Minute Wave ((iii)) Navy of Minor Wave 5 Grey is now progressing higher against 229. Alternatively Wave 5 Grey completed above 342.
Invalidation point: 229.
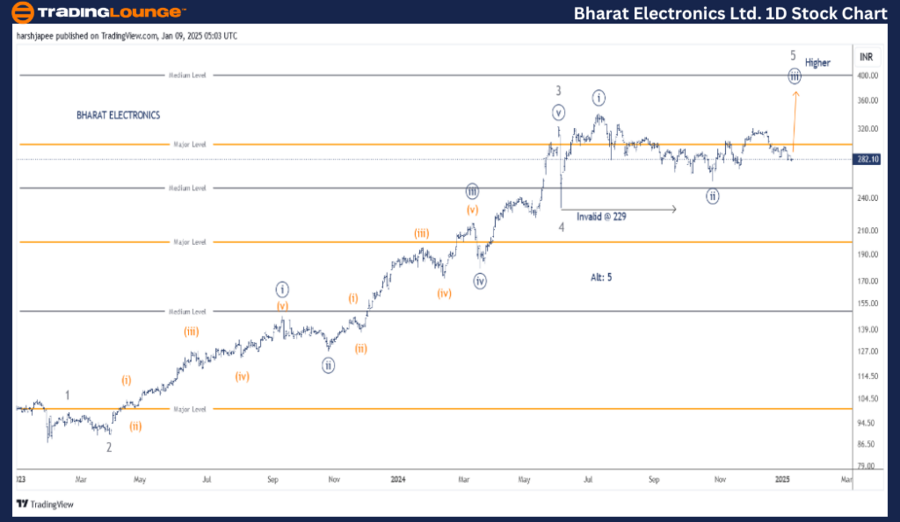
BEL Daily Chart Technical Analysis and potential Elliott Wave Counts:
BEL daily chart is indicating a progressive trend higher, which could be within its final Minor Wave 5 Grey higher towards 400 mark. The stock should stay above 229 mark, which is Minor Wave 4 termination. Furthermore, Minute Waves are unfolding within Minor Wave 5.
The stock had dropped through 90 levels in January 2023, terminating potential Intermediate Wave (4). Since then, a religious uptrend can be seen sub diving into Minor Waves 1 through 4 as marked on the daily chart here. Minor Wave was extended and rallied through 326 highs.
Minor Wave 4 bottomed around 229 mark and bulls are now looking poised to push higher as Minor Wave 5 unfolds. Bottom line for bulls to remain in control is the 229 low.
BHARAT Electronics Ltd – BEL (4H chart) Elliott Wave technical analysis
Function: Larger Degree Trend Higher (Intermediate degree, orange).
Mode: Motive.
Structure: Impulse.
Position: Minute Wave ((ii)) Navy.
Details: Minute Wave ((iii)) Navy of Minor Wave 5 Grey is now progressing higher against 229. Minute Wave ((iii)) is probably extending and prices should ideally stay above 259 to hold the above structure. Alternatively Wave 5 Grey completed above 342.
Invalidation point: 229.
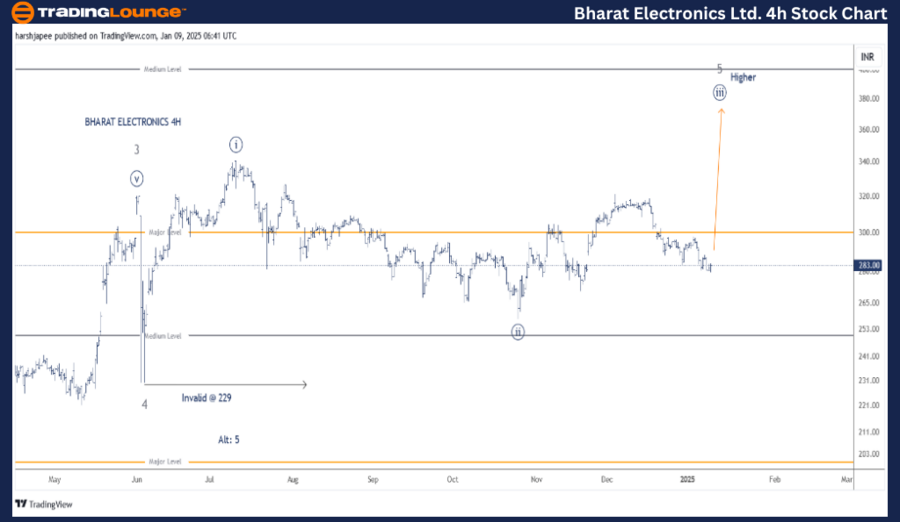
BEL 4H Chart Technical Analysis and potential Elliott Wave Counts:
BEL 4H chart is highlighting the sub waves after Minor Wave 4 Grey terminated around 229 mark in June 2024. Minute Wave ((i)) could be in place around 342 followed by Minute Wave ((ii)) terminating at 259 levels. Minute Wave ((iii)) could be unfolding and probably extending.
For the above structure to hold, prices must stay above 259 and broadly above 229 mark. A push above 318 would reconfirm that bulls are back in control and poised to target above 380 levels going forward.
Conclusion:
BEL is progressing higher within Minute Wave ((iii)) of Minor Wave 5 against 229 support.
Elliott Wave analyst: Harsh Japee.
BHARAT Electronics Ltd Elliott Wave technical analysis [Video]
Author

Peter Mathers
TradingLounge
Peter Mathers started actively trading in 1982. He began his career at Hoei and Shoin, a Japanese futures trading company.


