Better restaurants with Toast, Inc (TOST) support

Toast, Inc. (TOST) operates a cloud-based digital technology platform for the restaurant industry in the United States, Ireland, and India. The company offers software products for restaurant operations and point of sale. In addition, the company offers payroll and team management. Further, it offers reporting and analytics, Toast shop, and Toast partner connect and application programming interfaces. The company was formerly known as Opti Systems, Inc. and changed its name to Toast, Inc. in May 2012. Toast, Inc. was incorporated in 2011 and is headquartered in Boston, Massachusetts.
TOST May 2024 weekly chart
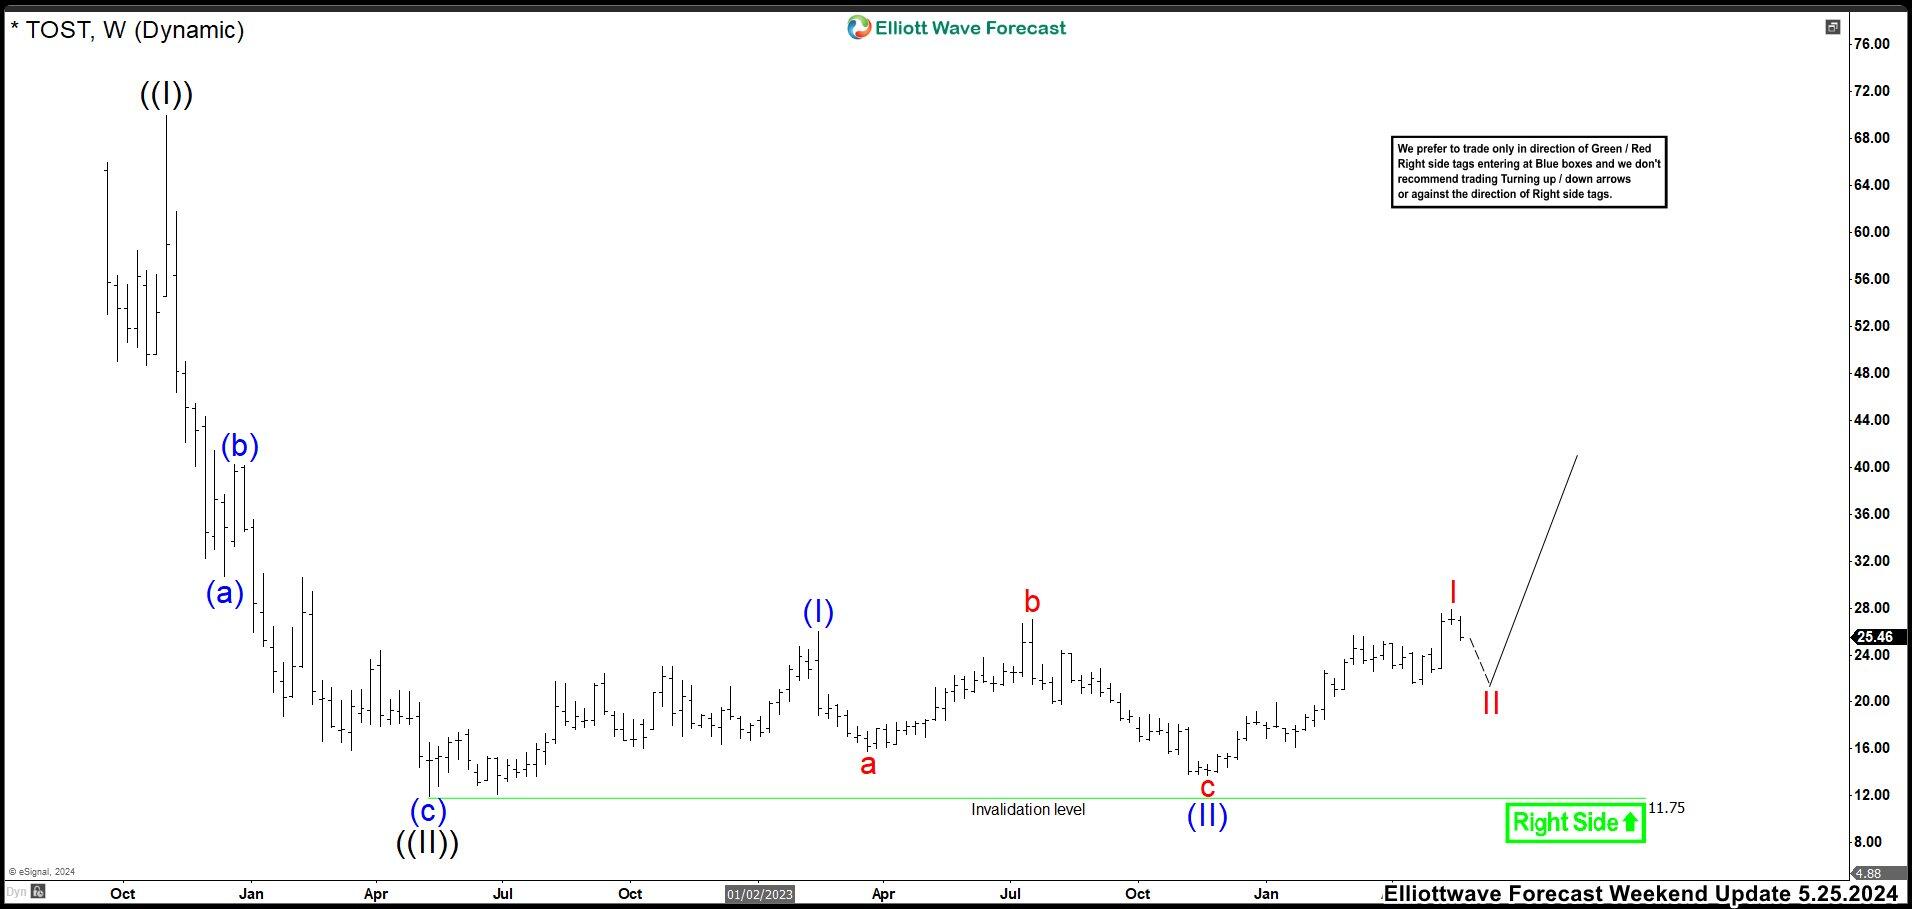
TOST completed a grand super cycle in 2012 reaching a share price of $69.93. We called this high wave ((I)). From here, the stock started to plummet and it reached a value of $11.91 in less than a year. We labeled this low as wave ((II)). Then the price started to move sideways fluctuating between $12 and $27 dollars. For this reason, we started to label nests looking for the stock to recover. The first group ended wave (I) at $26.04 high. The corrective wave (II) drew an expanded flat structure that ended at $13.27 low and then the market rally. The next bullish momentum reached its maximum at $27.90 and we labeled it as wave I. Therefore, we expected a correction as wave II before continuing a new rally again.
TOST November 2024 weekly chart
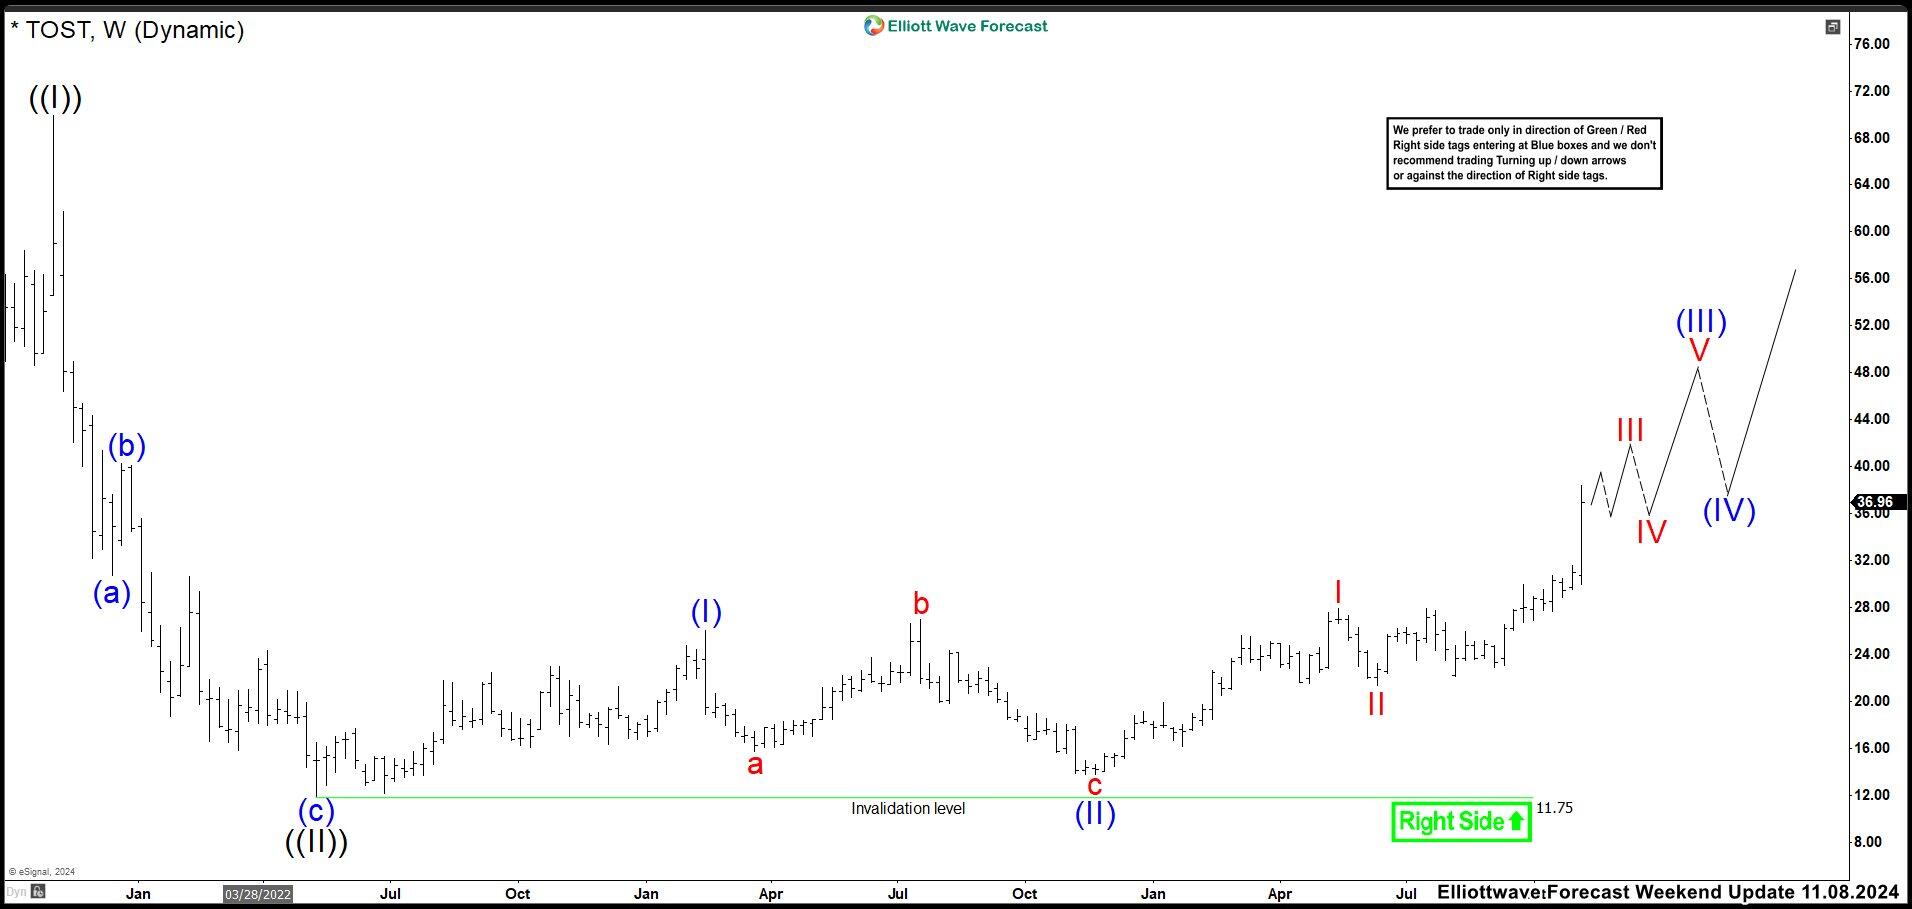
Currently weekly chart, we can see the correction as wave II. It ended at $21.32 low in June and continued moving sideways. We were waiting to break above wave I high to confirm that wave II has completed. In September, the market breaks above $27.90 and the bullish market was confirmed. TOST created a separation from the lows after US elections, suggesting a wave III higher. This wave III looks incomplete and we should see higher prices until the structure is ended and start a wave IV correction. The weekly chart is valid as price action stays above $11.91 low.
TOST November 2024 16H chart
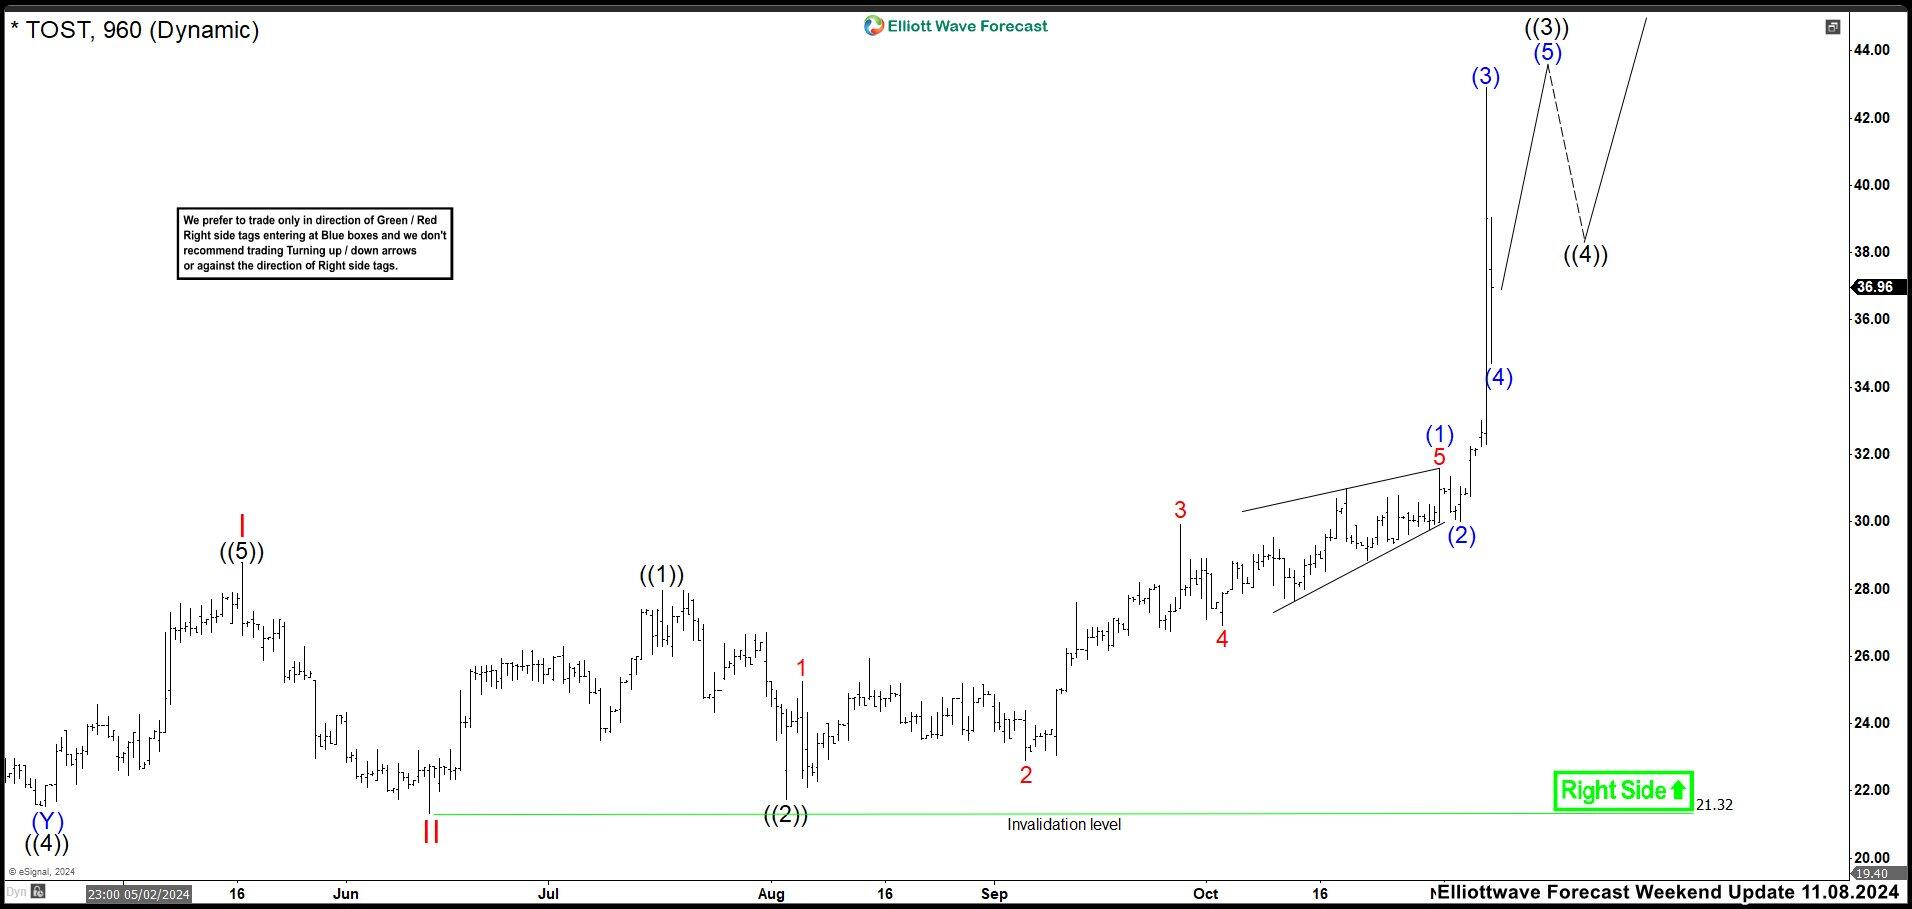
To get a closer look at what is happening in TOST, we are showing the 16-hour chart. We are not using the daily chart because it did not show the retracement of wave (4). We can clearly see the structure of wave III. Wave ((1)) of III ended at $27.95 high. Then, a correction finished at $21.76 low, close to breaking the low of $21.32, and we marked as wave ((2)). The wave ((3)) of III is still developing we expect to reach $43.00 – $45.00 area before starting a wave ((4)) pullback. The stock should continue moving higher to sideways until wave III is completed.
Author

Elliott Wave Forecast Team
ElliottWave-Forecast.com


