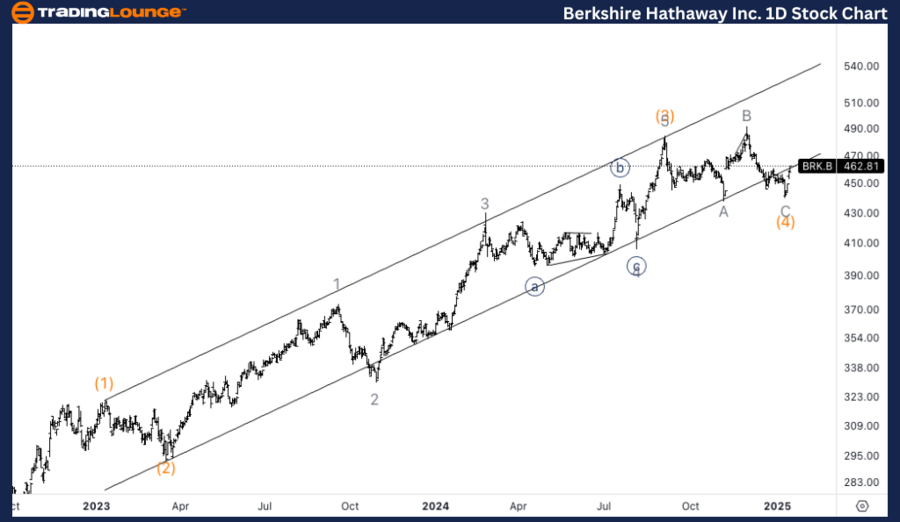
BRK.B Elliott Wave Analysis Trading Lounge.
Berkshire Hathaway Inc., (BRK:B) daily chart.
BRK:B Elliott Wave technical analysis
Function: Trend
Mode: Impulsive
Structure: Motive
Position: Wave 1 of (5).
Direction: Upside in wave 1.
Details: We are looking at a bottom in wave (4) in place as we hit the base of the parallel trend channel and we seem to have reacted from it in quite the impulsive manner for the past week.
BRK.B Elliott Wave technical analysis – Daily chart
We are observing a potential bottom in wave (4) as the price touched the base of the parallel trend channel and reacted sharply in an impulsive manner over the past week. This suggests the start of wave 1 of the final leg (wave 5), indicating a continuation of the uptrend.
BRK:B Elliott Wave technical analysis
Function: Trend
Mode: Impulsive
Structure: Motive
Position: Wave 1 of (5).
Direction: Upside in wave 1.
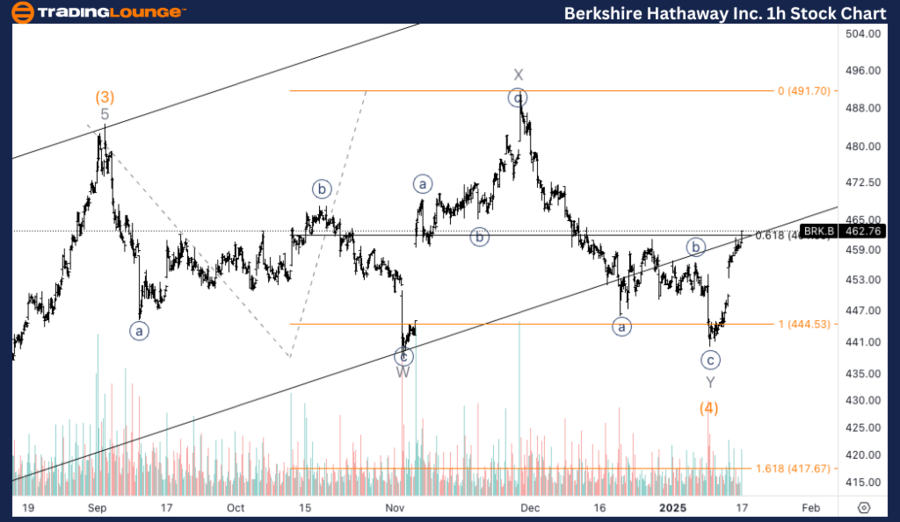
Details: Looking for a complex correction here as when we zoom in it seems like we had three waves of threes(double three). Looking for upside into wave 1 of (5). The strong reaction off equality of Y vs. W adds additional confirmation.
BRK.B Elliott Wave technical analysis – One-hour chart
On the 1H chart, we're seeing signs of a complex correction, with the wave structure appearing as a double three (three waves of threes). The strong upward reaction from the equality level of Y vs. W further supports the bullish scenario. We expect wave 1 of (5) to unfold next, continuing the upward momentum.
This analysis of Visa Inc., (V) focuses on both the daily and 1-hour charts, using the Elliott Wave Theory to assess current market trends and forecast future price movements.
Berkshire Hathaway Inc. (BRK:B) Elliott Wave technical analysis [Video]
As with any investment opportunity there is a risk of making losses on investments that Trading Lounge expresses opinions on.
Historical results are no guarantee of future returns. Some investments are inherently riskier than others. At worst, you could lose your entire investment. TradingLounge™ uses a range of technical analysis tools, software and basic fundamental analysis as well as economic forecasts aimed at minimizing the potential for loss.
The advice we provide through our TradingLounge™ websites and our TradingLounge™ Membership has been prepared without considering your objectives, financial situation or needs. Reliance on such advice, information or data is at your own risk. The decision to trade and the method of trading is for you alone to decide. This information is of a general nature only, so you should, before acting upon any of the information or advice provided by us, consider the appropriateness of the advice considering your own objectives, financial situation or needs. Therefore, you should consult your financial advisor or accountant to determine whether trading in securities and derivatives products is appropriate for you considering your financial circumstances.
Recommended content
Editors’ Picks
EUR/USD recovers toward 1.0500 after mixed US PMI data
EUR/USD rebounds toward 1.0500 in the American session on Friday after the data from the US showed that the business activity in the private sector expanded at a softer pace than anticipated in early February. The pair remains on track to end the week with little changed.
GBP/USD rises above 1.2650, looks to post weekly gains
GBP/USD regains its traction and trades above 1.2650 in the second half of the day on Friday. The data from the US showed that the S&P Global Services PMI dropped into the contraction territory below 50 in February, causing the US Dollar to lose strength and helping the pair edge higher.
Gold holds above $2,930 as US yields edge lower
Gold holds above $2,930 after correcting from the record-high it set above $2,950 on Thursday. Following the mixed PMI data from the US, the benchmark 10-year US Treasury bond yield stays in negative territory below 4.5% and allows XAU/USD to hold its ground.
Crypto exchange Bybit hacked for $1.4 billion worth of ETH
Following a security breach first spotted by crypto investigator ZachXBT, crypto exchange Bybit announced that it suffered a hack where an attacker compromised one of its ETH wallets.
Money market outlook 2025: Trends and dynamics in the Eurozone, US, and UK
We delve into the world of money market funds. Distinct dynamics are at play in the US, eurozone, and UK. In the US, repo rates are more attractive, and bills are expected to appreciate. It's also worth noting that the Fed might cut rates more than anticipated, similar to the UK. In the eurozone, unsecured rates remain elevated.
The Best brokers to trade EUR/USD
SPONSORED Discover the top brokers for trading EUR/USD in 2025. Our list features brokers with competitive spreads, fast execution, and powerful platforms. Whether you're a beginner or an expert, find the right partner to navigate the dynamic Forex market.