Welcome back to our deep dive series where this time we focus on placing a value on Warren Buffet. Well, not so much the man himself, but his mind and his company Berkshire Hathaway (BRK.B). Valuing Berkshire is a little more complex than a stand-alone company. Berkshire is a massive conglomerate and holding company, so we will likely spend more time on a sum of the parts valuation and emphasizing the book value of Berkshire. This will mean poring over its top 10 investments, which make up the majority of its equity holdings. Performing discounted cash flow and relative valuation techniques is slightly more complex here, but we will endeavor to use some common valuation metrics in our analysis.
We will then detail how the current macro environment will likely affect the main business areas of Berkshire before determining our fair value estimate and 12-month price target. At the outset, we should state that we are focusing on Berkshire Hathaway B shares, which are more accessible. Warren Buffet does not generally believe in share splits with the result that the original A shares of Berkshire Hathaway trade at $421,000 approximately. Yes, that is right, nearly half a million dollars to buy one share in BRK.A. Thankfully lower-priced B class shares were introduced in 1996 in response to demand from small investors for a slice of Buffet's pie.
"As I have told you before, we made this sale (Class B shares) in response to the threatened creation of unit trusts that would have marketed themselves as Berkshire look-alikes," Buffet said at the time. "In the process, they would have used our past, and definitely non-repeatable, record to entice naïve small investors and would have charged these innocents high fees and commissions."
Thus the B series was created. At the moment one A share represents 1500 B shares with slightly fewer voting rights attached to the B shares. So $421,000 divided by 1500 should give us the current value of the B shares as $280, which is correct as they are trading at the time of writing. We will focus our analysis on these more affordable B shares, which trade under the ticker BRK.B.
Contents
- Company overview and history
- Wall Street consensus forecasts
- Key valuation rating metrics
- Peer value comparison
- Macroeconomic backdrop, market cycle and sector analysis
- Forecast and valuation
- Technical analysis
- Executive summary, recommendation and price target
Company overview and history
Berkshire Hathaway is famous for being Warren Buffet's investment vehicle, but it is a much more complex organization than just a family fund. Berkshire operates across a diverse range of industries through a series of investments. Insurance is a big part of the business through its GEICO and Berkshire Reinsurance units. Railroads, energy, services and manufacturing are among the other focus areas. Burlington Northern Santa Fe Railroads and Berkshire Energy are other main interests. The stock was first listed on the New York Stock Exchange on March 17, 1980.
For the purposes of simplicity and valuation, the easiest visualization is to split the group into four parts. First, the insurance and reinsurance business through GEICO and Berkshire ReInsurance. Second, the energy division is represented mostly through Berkshire Hathaway Energy (BHE). Third, the railroad and freight business is represented by Burlington Northern Santa Fe (BNSF), and finally there is the equity investment division. The top 10 stocks account for slightly over 80% of the equity holdings at the last check, and in fact, Apple (AAPL) represents about 40% of the equity portfolio.
If we look at Berkshire's most recent company filings, we can see that insurance and other revenues are the largest contributors to overall revenue. Berkshire splits the overall revenue streams into three entities: Insurance; Railroad, utilities and energy; and finally investment gains/losses.
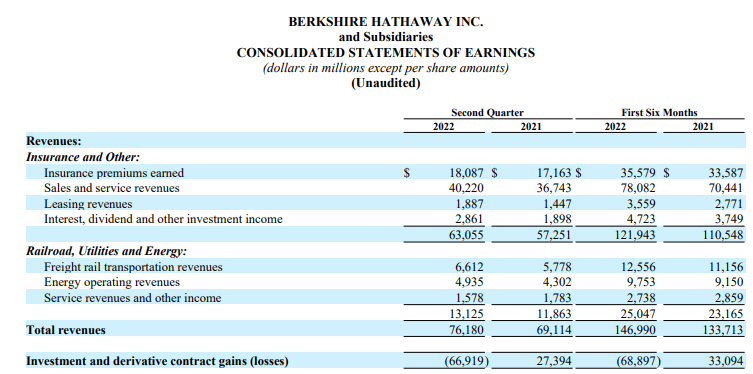
Source: Berkshire company filings Form 10-Q
Berkshire Hathaway is the classic value stock with Warren Buffet being a value investor and disciple of Benjamin Graham, the father of the value investing method. This means the stock and Warren Buffet take the extremely long-term view. In fact the time horizon tends to be multi-decades long, so it is likely then that Berkshire underperforms in frothy growth markets and outperforms bear markets. This was certainly the case in the post-2000 DotCom crash and again in the post-Great Financial Crisis time period. Now, we have witnessed Berkshire Hathaway underperform the surging pandemic bull market only to catch up as we enter a new bear cycle. We can see this clearly in the series of charts below.
Also read: Apple Stock Deep Dive: AAPL price target at $100 on falling 2023 revenues
Here is the 2022 year-to-date performance: Berkshire (BRK.B) in red versus the S&P 500 in green and Nasdaq in blue. Berkshire is -6% year to date, while the others are far worse.
-637992733211260950.png)
If we go back to March 2020 and the pandemic lows, we can see the Nasdaq (blue line) was the star performer with Berkshire (red line) lagging behind until catching up in 2022. Now it is tieing the Nasdaq and outperforming the S&P 500.
-637992734320679770.png)
Even worse if we go back to the start of the Great Financial Crisis in 2008. This is the start of the Fed's quantitative easing, which was then increased in 2020. The Nasdaq understandably benefits the most from zero interest rates and monetary stimulus.
-637992735982336187.png)
However, during bear markets or crises is when value investing reaps its rewards. The chart below shows the 2005 to 2014 period.
-637992738332775069.png)
Here is when the DotCom bubble burst in 2000. Nasdaq lost 20% of its value after supposedly bottoming out in 2000. From 2000 to 2008, the Nasdaq was -20%, while Berkshire was nearly up 90%.
-637992740113813660.png)
Wall Street consensus forecasts
Source: Refinitiv
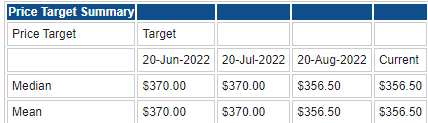
Surprise, surprise, the Wall Street analyst community is bullish. Yet to see in our deep dive series where they are not strongly bullish. The average price target has been declining though and following Mr. Market lower.
Key Valuation rating metrics
Market cap: $606 billion
Enterprise value: $630 billion
IPO date: 17th March 1980
52-week high: $362.10
52-week low: $263.68
Short interest: 0.03%
YTD performance: 1.70%
5-year performance: 51%
Source: Refinitiv, TradingView and FXStreet calculations
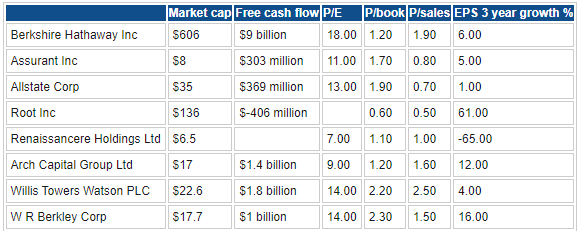
Peer value comparison
Berkshire does not really have any direct competitors as it operates in such a widespread and diverse range of industries. For the sake of comparison, we include insurance as a benchmark.
Macroeconomic backdrop, market cycle and sector analysis
Financial conditions remain difficult with the Federal Reserve set to add another 75 basis points to interest rates on its September meeting. This is in addition to a series of recent rate hikes from the Bank of England, European Central Bank and Swedish central bank, which surprised markets with a 100 bps rate hike this week. All in all, a tightening credit environment is not usually conducive to strong equity performance, and so it is proving with the main indices in bear market territory and the Nasdaq underperforming. However, as we have shown in our charts above it is in exactly these sorts of environments that Warren Buffet tends to revel, and as a result Berkshire Hathaway outperforms. Already he is taking a significant stake in Occidental Petroleum to perhaps augment his energy business and provide a backstop against inflation.
Also read: Citi Stock Deep Dive: Earnings, Buffet factor support our BUY rating and $60 price target
All eyes will turn to the next Fed interest rate decision as I write. This will likely see another 75 bps rate hike, but it is the path of future interest rate hikes that is more important for equity investors. Currently, the market is betting that interest rates will begin to stabilize and even decrease sometime during 2023. However, the recent hawkish tone and higher-than-expected CPI have caused this prediction to revert. Equity markets need lower rates, especially the longer-duration Nasdaq stocks.
Prior to last week's CPI, the fed funds futures market and other fixed income markets were predicting up to 50bps of rate cuts in 2023. Now the consensus has moved to rates staying higher for longer and rates remaining flat for much of 2023. That is already causing equities some stress. Below we plot the yield according to the fed funds futures Dec 2023 contract. Last week we see after the CPI the prediction moved up by over 50bps! This was a huge move and a shock to the system for equities. If the Fed continues its hawkish stance and outlines a dot plot of higher rates for longer, then expect more declines for equities.
Fed funds futures, December 2023 expiry
Valuations will need to come down if this period of high inflation and low growth becomes entrenched, which already looks possible. The Atlanta Fed GDPNow tool is already signaling a third GDP contraction in a row.
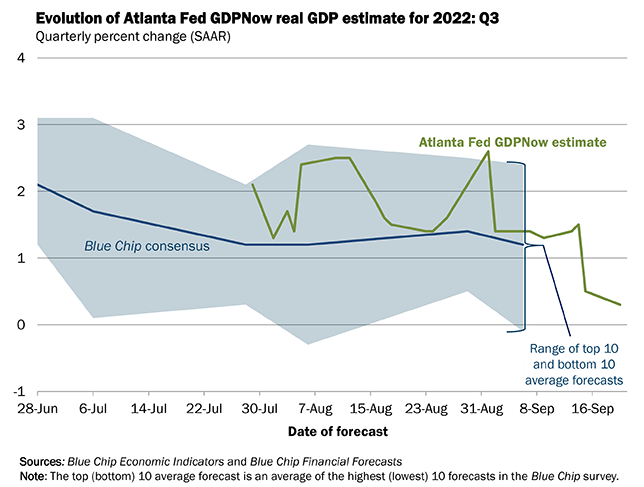
Source: Atlantafed.org
Here is what happens to valuations in a stagflationary environment.
The Price to Earnings Ratio (P/E) is higher when inflation is low and growth rates are high. During stagflation or times when growth is slow & inflation is high, the P/E ratio goes down. In the stagflationary '70s, the P/E for the S&P 500 $SPY went to single digits. pic.twitter.com/l86bRaKLxz
— Ben Woodward, CFA (@BennettWoodman) September 9, 2022
Berkshire Hathaway forecast and valuation
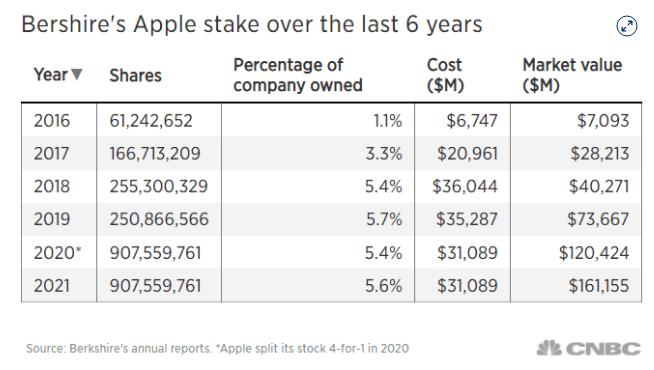
We run through the standard discounted cash flow analysis (DCF) as well as relative valuation techniques. Berkshire is a more complex entity given its three distinct business lines. We have to analyze the prospects for each one separately as well as then analyze the individual equity holdings that make up an enormous part of the business. Fortunately, Apple is Berkshire's main equity holding, and we have already performed a deep dive on Apple stock. The top holdings as of the last quarter are detailed below.
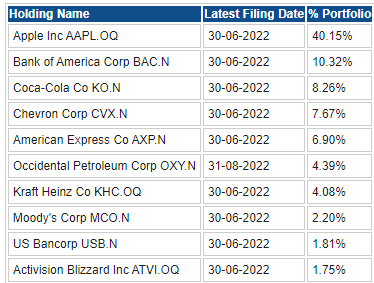
Source: SEC filings, Refinitiv
As we can see, Berkshire has bet the house on Apple, so this will inform our projections.
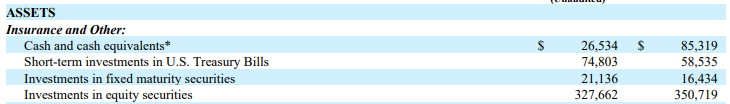
At the end of June 2022, Berkshire held $327 billion worth of equity securities, and in the quarter it took a loss of $67 billion approximately. Given the downward spiral of equities, we expect this trend to continue into 2023. However, since June, Apple stock has rallied sharply, so next quarter should not see a repeat of these losses on investments and indeed perhaps could show a healthy gain.
However, for 2023 we are looking at further losses and anticipate the value of Berkshire's investments to fall by approximately 20%. The total portfolio value is in the region of $330 billion, so a 20% drop represents a staggering near $70 billion in losses. As we can see already, that is par for the course with a long-term time horizon. Berkshire has cash and short-term T-bills totaling nearly $100 billion. Cash should see a higher yield, but this will be offset by losses on bonds as yields rise further. (The price of a bond in general falls as interest rates rise.)

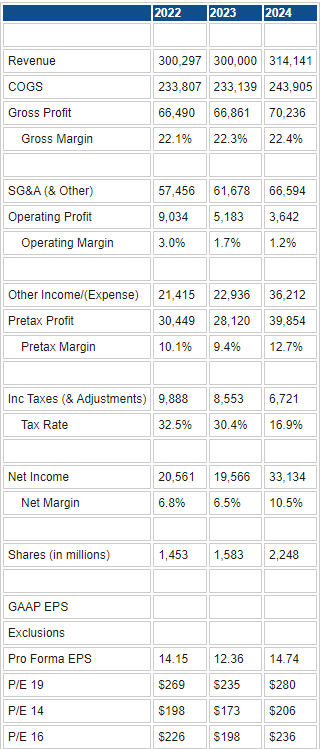
Starting with consensus estimates, we adjust 2023 to take into account likely losses from equity investments. We conservatively take down revenues by 10% to reflect an overall decline of at least that in the equity investment book. Our deep dive currently has Apple declining to $100, which would be a much larger drop. That gives us a discounted cash flow price more or less in line with the current market price: $245.53, slightly below the $277 current price for Berkshire Hathaway B shares.
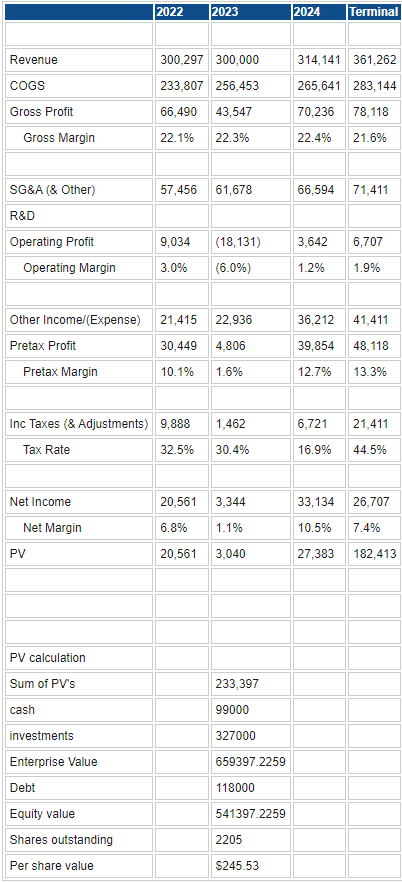
Source: Refinitiv and FXStreet calculations
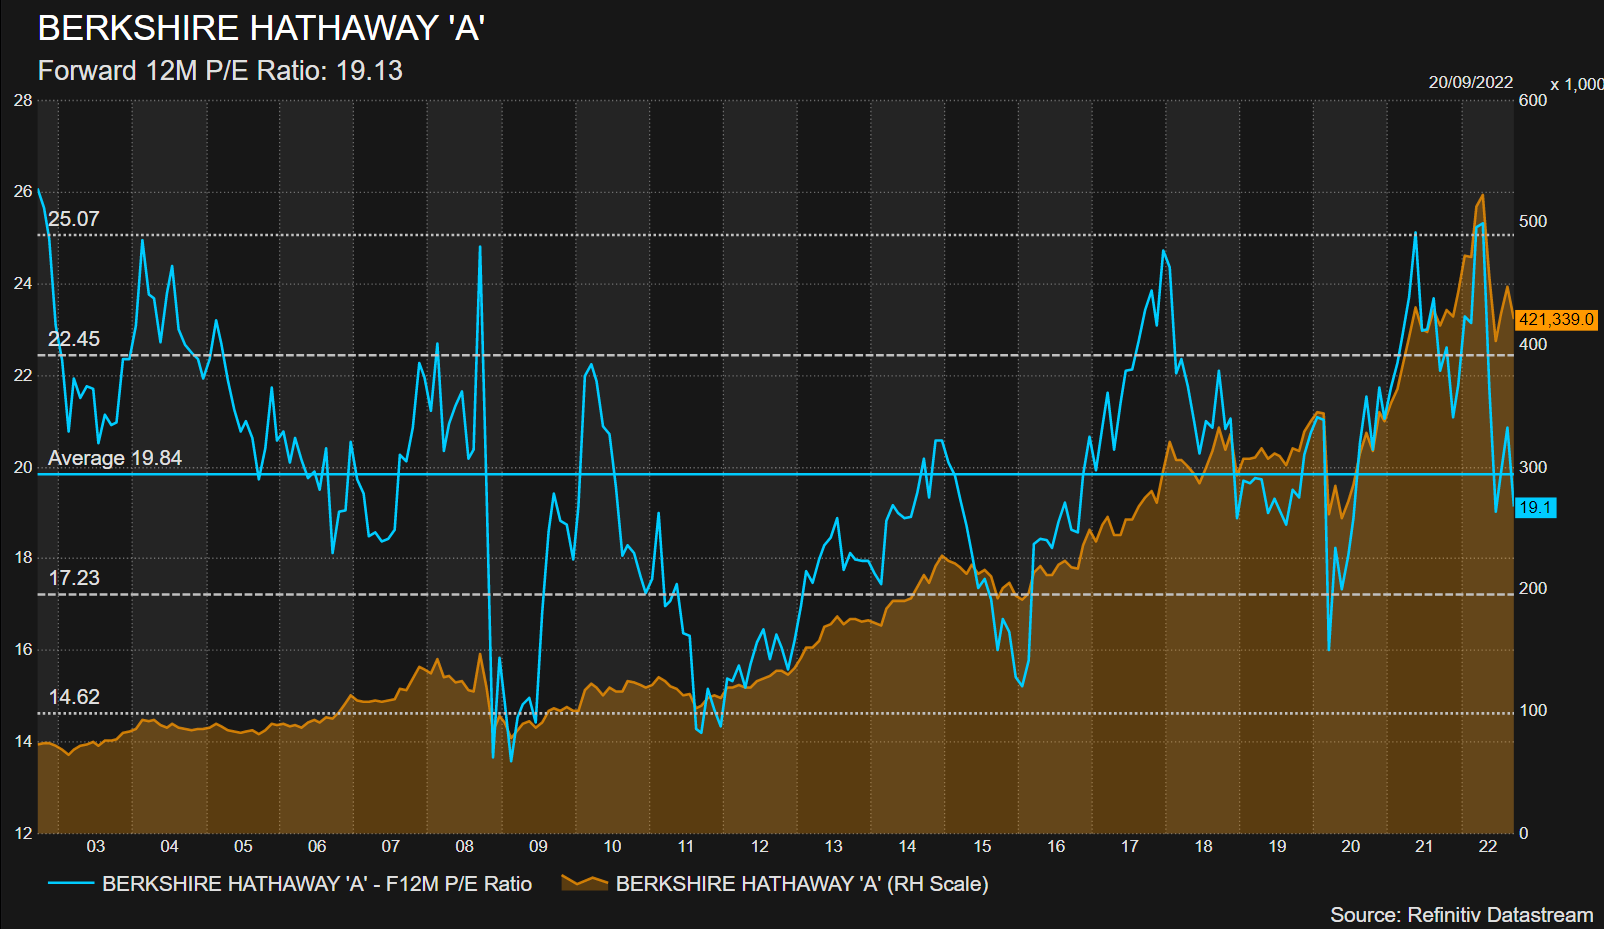
Next, we outline using relative valuation or the more standard price/earnings model, meaning comparisons across industries and stocks can be made. We can see from our Datastream chart below the worst-case P/E ratio for Berkshire is not much below 14 during the Great Financial Crisis. Berkshire's current P/E is in line with its 20-year average of 19. This gives a range for 2023 estimates at $235-to-$173 based on the P/E ratio reverting to the worst case. Given no one hopes or expects a repeat of the last financial crisis, a P/E at the midpoint seems appropriate at 16. This gives a 2023 price target of $198.
Also read: McDonald's Stock Deep Dive Analysis: MCD price target at $200 on high valuation, flat revenues
Source: Refinitiv and FXStreet calculations
This may come as some surprise to Buffet or value disciples, and I include myself in that group. Apple representing 40% of the portfolio does expose Berkshire to the AAPL stock price. As we can see below, the correlation between Apple and Berkshire is running pretty strongly.
-637992637355282074.png)
Berkshire Hathaway (red line) versus Apple (blue line) back to 2020.
Also read: Walmart Deep Dive Analysis: Hold WMT to play defense vs upcoming US recession
Berkshire Hathaway technical analysis
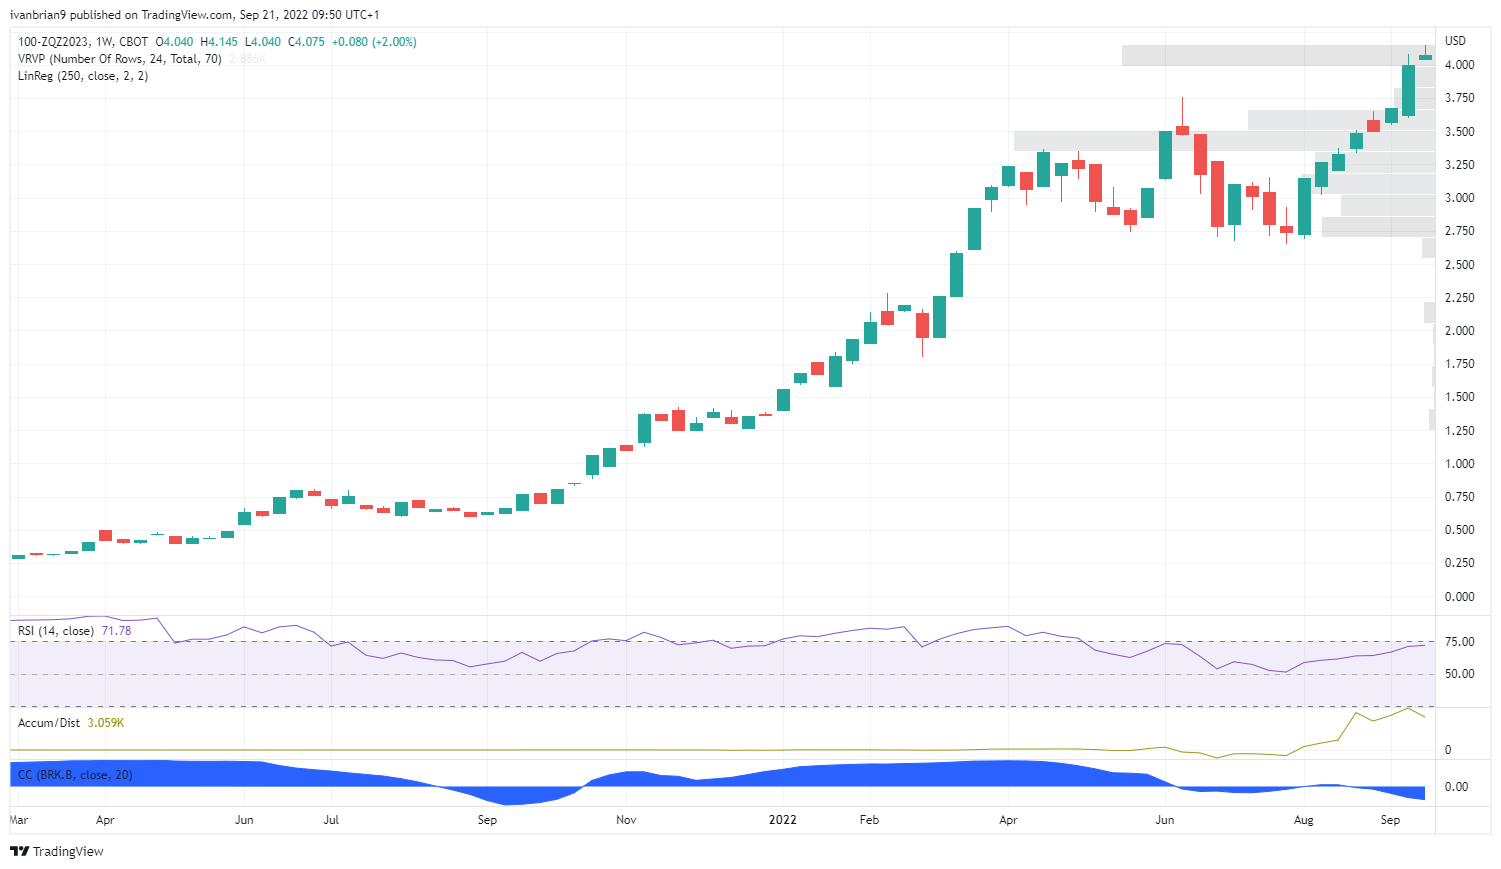
Forecasting Berkshire Hathaway to fall in price is not the investing sin it might seem despite it going against my own admiration for the Buffet Value investing philosophy. As we can see, there have been many instances of large drawdowns in the Berkshire share price. The DotCom bubble bursting saw a decline of about 50%. The Great Financial Crisis saw another decline of more than 50%, and again the covid pandemic saw a sharp 30% sell-off. Already this year, BRK.B is down from $359 in March. It is also forming a bearish head-and-shoulders pattern which would have a price target of $180 approximately.
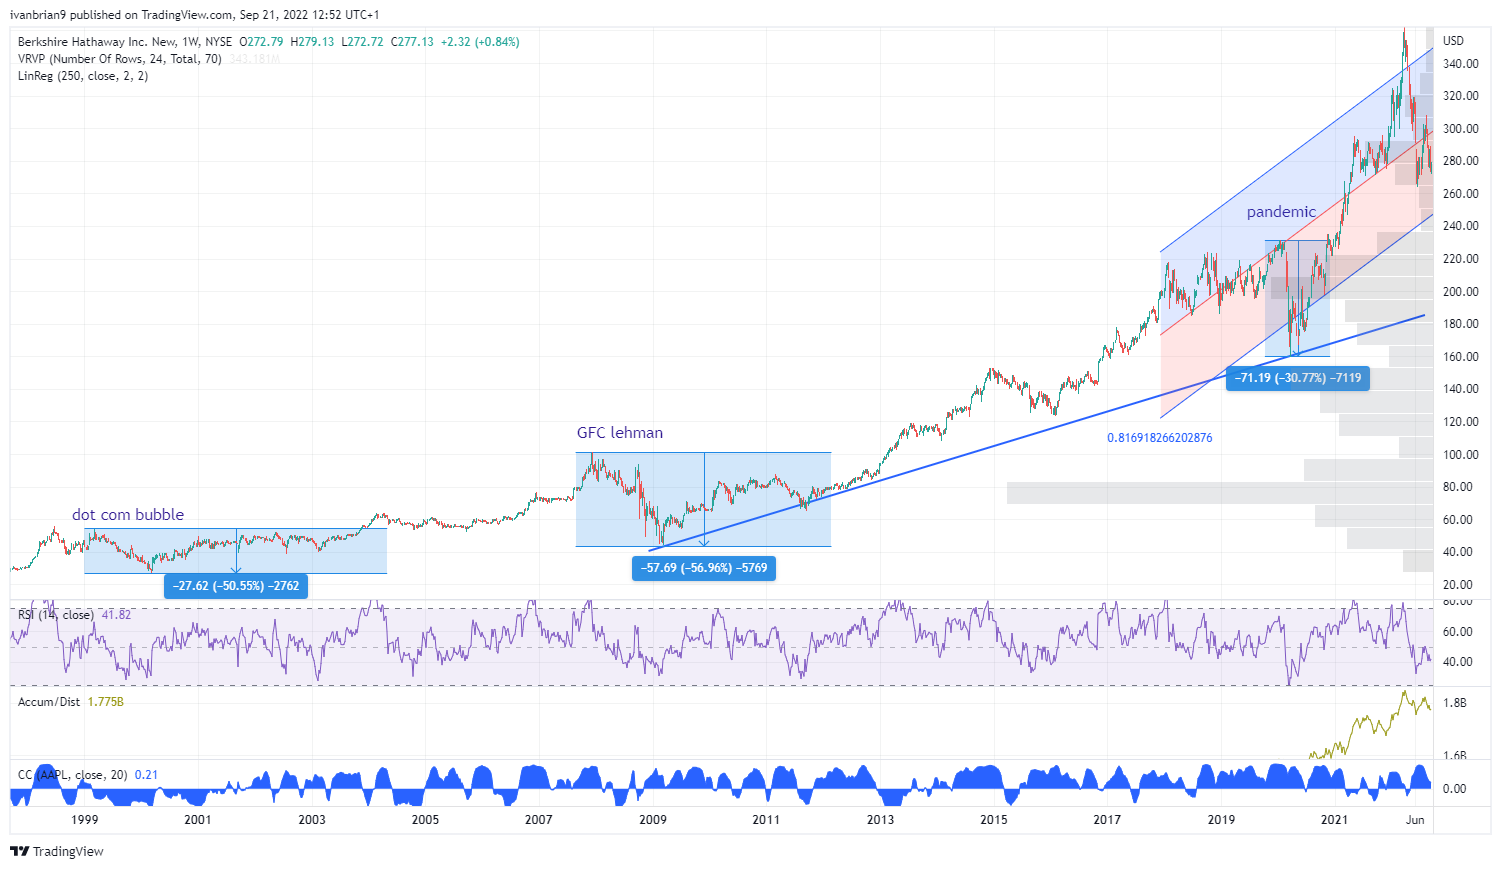
Berkshire Hathaway B shares BRK.B weekly
Executive Summary: Price target and recommendation
Overall, a BRK.B stock 12-month price target of $200 feels appropriate. This is based primarily on the continued decline in the value of Berkshire's investment portfolio and its large exposure to Apple. So far, Apple has held up reasonably well, but with rising rates, I feel iPhone 14 demand may slow alarmingly once the holiday season is past.
Upside risks
- Apple's (AAPL) stock continues to outperform.
- The insurance business remains strong and highly cash generative.
Downside risks
- Apple falls sharply toward our $100 12-month price target.
- Warren Buffet is 92 years old. He will not be in charge forever. How will investors react to a management transition? For example, Apple shares fell when Steve Jobs announced he was stepping down and fell again when he died. Amazon fell sharply when Jeff Bezos announced he was stepping down as CEO. Investors buy into management as much as the company itself.
- Deeper recession than forecast.
As ever Warren Buffet invests for the long run. Multi-decade is his time horizon. Buying the dip may be a dying art, but buying the dip in Berkshire Hathaway has always paid off in the long run. Expect nothing different this time despite some near-term headwinds. Stanley Druckenmiller recently said that we may be in for a 10-year period of sideways or bear markets. He also said there were many great stocks to pick the last time we entered such a market. This is where Warren Buffets' skill lies.
Information on these pages contains forward-looking statements that involve risks and uncertainties. Markets and instruments profiled on this page are for informational purposes only and should not in any way come across as a recommendation to buy or sell in these assets. You should do your own thorough research before making any investment decisions. FXStreet does not in any way guarantee that this information is free from mistakes, errors, or material misstatements. It also does not guarantee that this information is of a timely nature. Investing in Open Markets involves a great deal of risk, including the loss of all or a portion of your investment, as well as emotional distress. All risks, losses and costs associated with investing, including total loss of principal, are your responsibility. The views and opinions expressed in this article are those of the authors and do not necessarily reflect the official policy or position of FXStreet nor its advertisers. The author will not be held responsible for information that is found at the end of links posted on this page.
If not otherwise explicitly mentioned in the body of the article, at the time of writing, the author has no position in any stock mentioned in this article and no business relationship with any company mentioned. The author has not received compensation for writing this article, other than from FXStreet.
FXStreet and the author do not provide personalized recommendations. The author makes no representations as to the accuracy, completeness, or suitability of this information. FXStreet and the author will not be liable for any errors, omissions or any losses, injuries or damages arising from this information and its display or use. Errors and omissions excepted.
The author and FXStreet are not registered investment advisors and nothing in this article is intended to be investment advice.
Recommended content
Editors’ Picks

EUR/USD regains traction and bounces off daily lows
After bottoming out near 1.0450, EUR/USD managed to regain some balance and revisit the 1.0470 zone on the back of alternating risk appetite trends in the FX world and amid investors' assessment of the German elections.

GBP/USD retreats below 1.2650 as markets await comments from BoE officials
GBP/USD retreats from the multi-month high it touched earlier and trades below 1.2650 on Monday. The pair eases as the US Dollar pauses its decline but the downside appears limited ahead of speeches from several BoE policymakers.

Gold climbs to an all-time high near $2,960
Prices of Gold glimmered higher on Monday, hitting an all-time high around $2,955 per ounce troy on the back of the US Dollar's inconclusive price action as investors are warming up for a key inflation report due toward the end of the week.

Bitcoin Price Forecast: BTC standoff continues
Bitcoin has been consolidating between $94,000 and $100,000 since early February. Amid this consolidation, investor sentiment remains indecisive, with US spot ETFs recording a $540 million net outflow last week, signaling institutional demand weakness.

Money market outlook 2025: Trends and dynamics in the Eurozone, US, and UK
We delve into the world of money market funds. Distinct dynamics are at play in the US, eurozone, and UK. In the US, repo rates are more attractive, and bills are expected to appreciate. It's also worth noting that the Fed might cut rates more than anticipated, similar to the UK. In the eurozone, unsecured rates remain elevated.

The Best brokers to trade EUR/USD
SPONSORED Discover the top brokers for trading EUR/USD in 2025. Our list features brokers with competitive spreads, fast execution, and powerful platforms. Whether you're a beginner or an expert, find the right partner to navigate the dynamic Forex market.