Bed Bath & Beyond Stock Price and Forecast: Why did BBBY stock collapse?


  • Bed Bath & Beyond closed Wednesday up over 15%.
  • But that is a collapse from premarket when BBBY was up nearly 90%.
  • BBBY stock is a meme name and saw heavy retail trading on Wednesday.

That was a rollercoaster ride as the back to the future trend continues with meme stocks roaring back into life with some gains sparking memories of the original move back in January of this year. BBBY surged on Wednesday and was up nearly 90% at one stage as retail traders piled into the name. The stock was unable to hold onto such huge gains, which is not surprising, and dropped alarmingly to close only 15% higher. Most stocks would bite your hand for a 15% gain, but when you have seen it nearly double perspective is required. 

BBBY chart, 15-minute

Bed Bath & Beyond (BBBY) stock news

The announcement of a tie-in with Kroger (KR) to directly offer its customers a selection of BBBY products helped fuel the parabolic move and added to this was news of an acceleration of BBBY's $1 billion buyback program. It is likely the acceleration of the share repurchase program that really got the excitement levels of traders up as Telsey Advisory Group said in a research note to clients, "The announcements should be received positively by investors, especially the share buyback, which we estimate has the potential to reduce the share count by 15% and boost 2022 EPS." 

Bed Bath & Beyond CEO Mark Tritton said on Wednesday about the buyback: "We'll be prudent within the year on when and how we purchase." This appears to sound somewhat cautious, but given we only have two months left for the buyback now there is not much time to be prudent. 

Bed Bath & Beyond (BBBY) stock forecast

We really cannot reiterate this enough, go back and look at the most recent results. You do not have to go too far back. BBBY earnings were on September 30, and EPS missed by a whopping amount. The stock tanked.

Here we are barely one month later and all is forgiven? We are not so sure. The stock is reportedly well shorted with a reputed 30% short interest. Our Refinitive figures list it at 26.5% as of October 14. Significant but at only 4 days to cover based on average volumes, it is not super high and is a lot lower than back in January. Looking at the BBBY chart gives a clear technical picture.

The move spiked up into a huge resistance level. $28.30 is the point of control or the price with the highest volume. The 200-day moving average is at $26.41, and the yearly Volume Weighted Average Price (VWAP) is also at $28. This creates massive resistance as highlighted in the chart below. It is the consolidation phase for most of the summer. That will be tough to crack. The powerful gap up on Wednesday has almost totally retraced. Holding $20 gives bulls some hope that the move may stabilize. Breaking $20 and it is all over, and the gap back to $17 will get filled then.
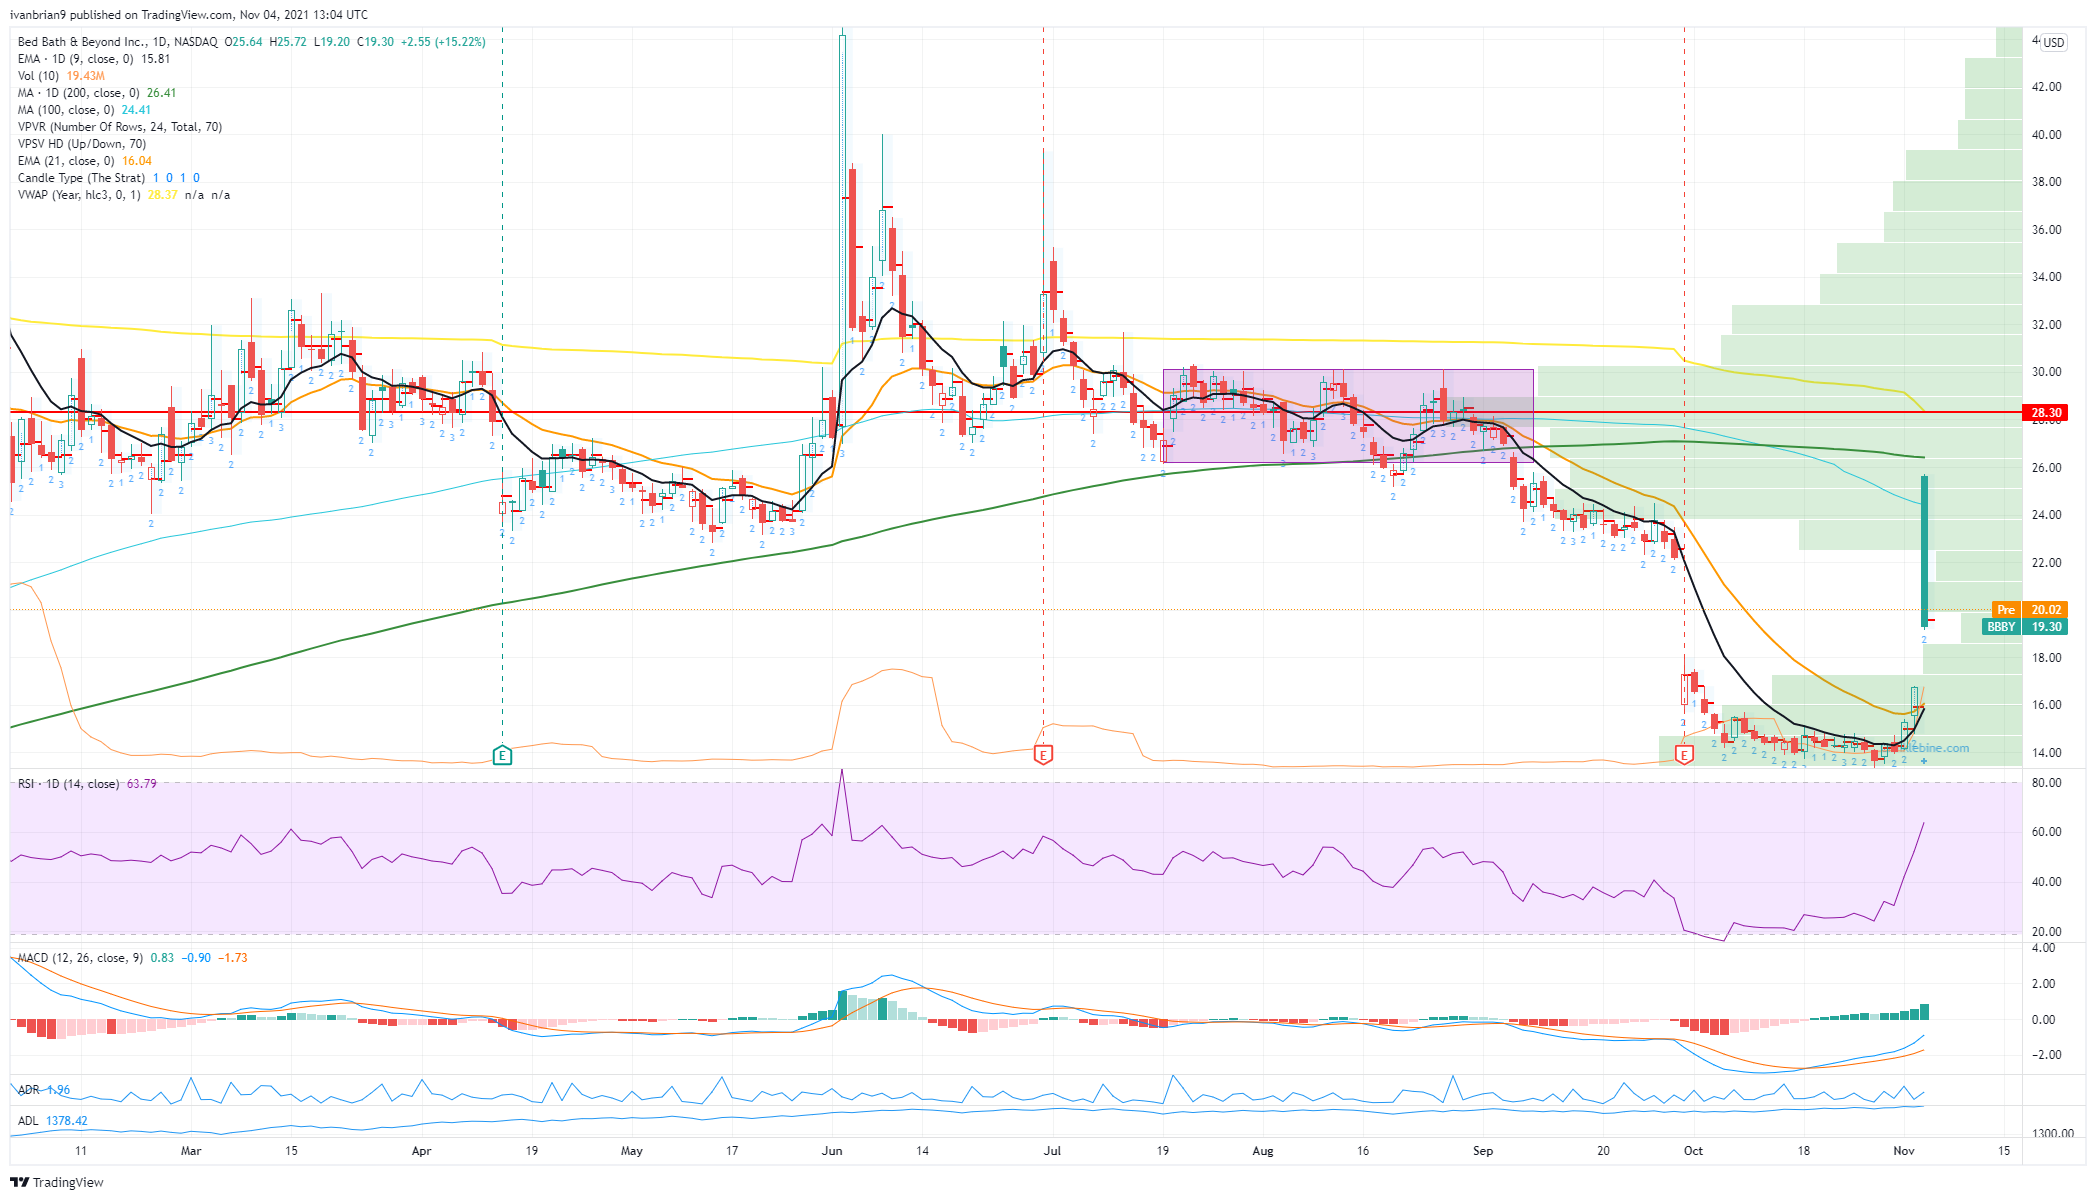
BBBY 1-day chart

Share: Feed news

Information on these pages contains forward-looking statements that involve risks and uncertainties. Markets and instruments profiled on this page are for informational purposes only and should not in any way come across as a recommendation to buy or sell in these assets. You should do your own thorough research before making any investment decisions. FXStreet does not in any way guarantee that this information is free from mistakes, errors, or material misstatements. It also does not guarantee that this information is of a timely nature. Investing in Open Markets involves a great deal of risk, including the loss of all or a portion of your investment, as well as emotional distress. All risks, losses and costs associated with investing, including total loss of principal, are your responsibility. The views and opinions expressed in this article are those of the authors and do not necessarily reflect the official policy or position of FXStreet nor its advertisers. The author will not be held responsible for information that is found at the end of links posted on this page.

If not otherwise explicitly mentioned in the body of the article, at the time of writing, the author has no position in any stock mentioned in this article and no business relationship with any company mentioned. The author has not received compensation for writing this article, other than from FXStreet.

FXStreet and the author do not provide personalized recommendations. The author makes no representations as to the accuracy, completeness, or suitability of this information. FXStreet and the author will not be liable for any errors, omissions or any losses, injuries or damages arising from this information and its display or use. Errors and omissions excepted.

The author and FXStreet are not registered investment advisors and nothing in this article is intended to be investment advice.

XM
Account
7.2
Tools
9.2
Service
9.4
Trading
9.0
Trust
7.0
Experience
8.4
Read review
Moneta Markets
Account
7.4
Tools
6.6
Service
8.0
Trading
6.6
Trust
5.2
Experience
9.2
Read review
Trading Pro
Account
7.2
Tools
5.2
Service
6.6
Trading
8.0
Trust
5.0
Experience
7.0
Read review
Pepperstone
Account
8.2
Tools
8.2
Service
7.4
Trading
9.0
Trust
8.8
Experience
9.0
Read review
XM
Read review
Moneta Markets
Read review
Trading Pro
Read review
Pepperstone
Read review
Trading Pro
Read review
Pepperstone
Read review
XM
Read review
Moneta Markets
Read review
Trading Pro
Account
7.2
Tools
5.2
Service
6.6
Trading
8.0
Trust
5.0
Experience
7.0
Read review
Pepperstone
Account
8.2
Tools
8.2
Service
7.4
Trading
9.0
Trust
8.8
Experience
9.0
Read review
XM
Account
7.2
Tools
9.2
Service
9.4
Trading
9.0
Trust
7.0
Experience
8.4
Read review
Moneta Markets
Account
7.4
Tools
6.6
Service
8.0
Trading
6.6
Trust
5.2
Experience
9.2
Read review

Recommended content


Recommended content

Editors’ Picks

Gold hovers around all-time highs near $3,250

Gold hovers around all-time highs near $3,250


Gold is holding steady near the $3,250 mark, fuelled by robust safe-haven demand, trade war concerns, and a softer-than-expected US inflation gauge. The US Dollar keeps trading with heavy losses around three-year lows.

Gold News
EUR/USD retreats towards 1.1300 as Wall Street shrugs off trade war headlines

EUR/USD retreats towards 1.1300 as Wall Street shrugs off trade war headlines

The EUR/USD pair retreated further from its recent multi-month peak at 1.1473 and trades around the 1.1300 mark. Wall Street manages to advance ahead of the weekly close, despite escalating tensions between Washington and Beijing and mounting fears of a US recession. Profit-taking ahead of the close also weighs on the pair. 

EUR/USD News
GBP/USD trims gains, recedes to the 1.3050 zone

GBP/USD trims gains, recedes to the 1.3050 zone

GBP/USD now gives away part of the earlier advance to fresh highs near 1.3150. Meanwhile, the US Dollar remains offered amid escalating China-US trade tensions, recession fears in the US, and softer-than-expected US Producer Price data.

GBP/USD News
Bitcoin, Ethereum, Dogecoin and Cardano stabilze –  Why crypto is in limbo

Bitcoin, Ethereum, Dogecoin and Cardano stabilze –  Why crypto is in limbo

Bitcoin, Ethereum, Dogecoin and Cardano stabilize on Friday as crypto market capitalization steadies around $2.69 trillion. Crypto traders are recovering from the swing in token prices and the Monday bloodbath. 

Read more
Is a recession looming?

Is a recession looming?

Wall Street skyrockets after Trump announces tariff delay. But gains remain limited as Trade War with China continues. Recession odds have eased, but investors remain fearful. The worst may not be over, deeper market wounds still possible.

Read more
The Best brokers to trade EUR/USD

The Best brokers to trade EUR/USD

SPONSORED Discover the top brokers for trading EUR/USD in 2025. Our list features brokers with competitive spreads, fast execution, and powerful platforms. Whether you're a beginner or an expert, find the right partner to navigate the dynamic Forex market.

Read More

Forex MAJORS

Cryptocurrencies

Signatures

Best Brokers of 2025