Bearish distribution pattern emerged in the S&P 500 [Video]
![Bearish distribution pattern emerged in the S&P 500 [Video]](https://editorial.fxsstatic.com/images/i/SP500-bearish-withoutbear_XtraLarge.jpg)
Watch the video from the WLGC session on 4 Mar 2025 to find out the following:
-
The 2 bearish characteristics traders need to watch out for.
-
The key differences between the first, second, and third segments in the S&P 500 structure.
-
The key supports & resistance level in the S&P 500, Nasdaq 100, Dow Jones, and Russell 2000.
-
and a lot more...
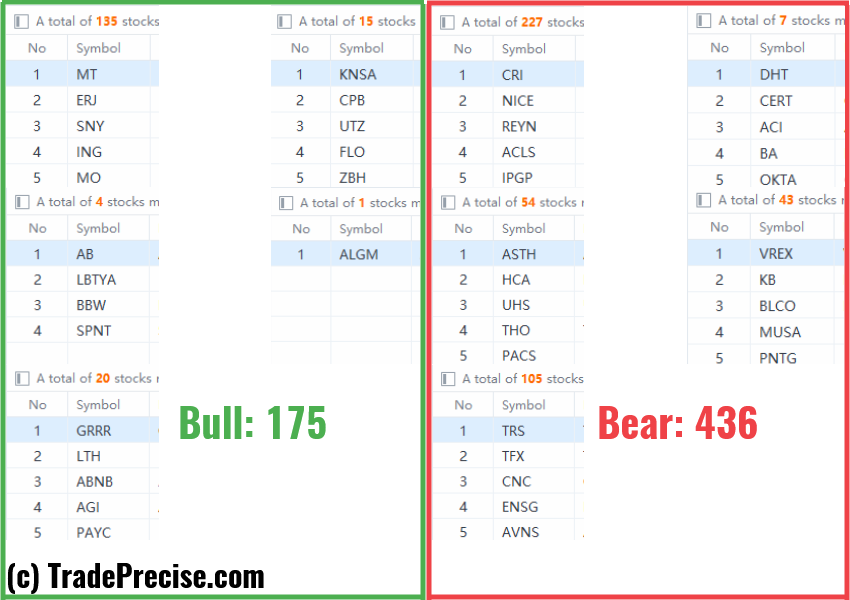
Market environment
The bullish vs. bearish setup is 175 to 436 from the screenshot of my stock screener below.
Three stocks ready to soar
11 actionable setups such as AHR, WELL were discussed during the live session before the market open (BMO).
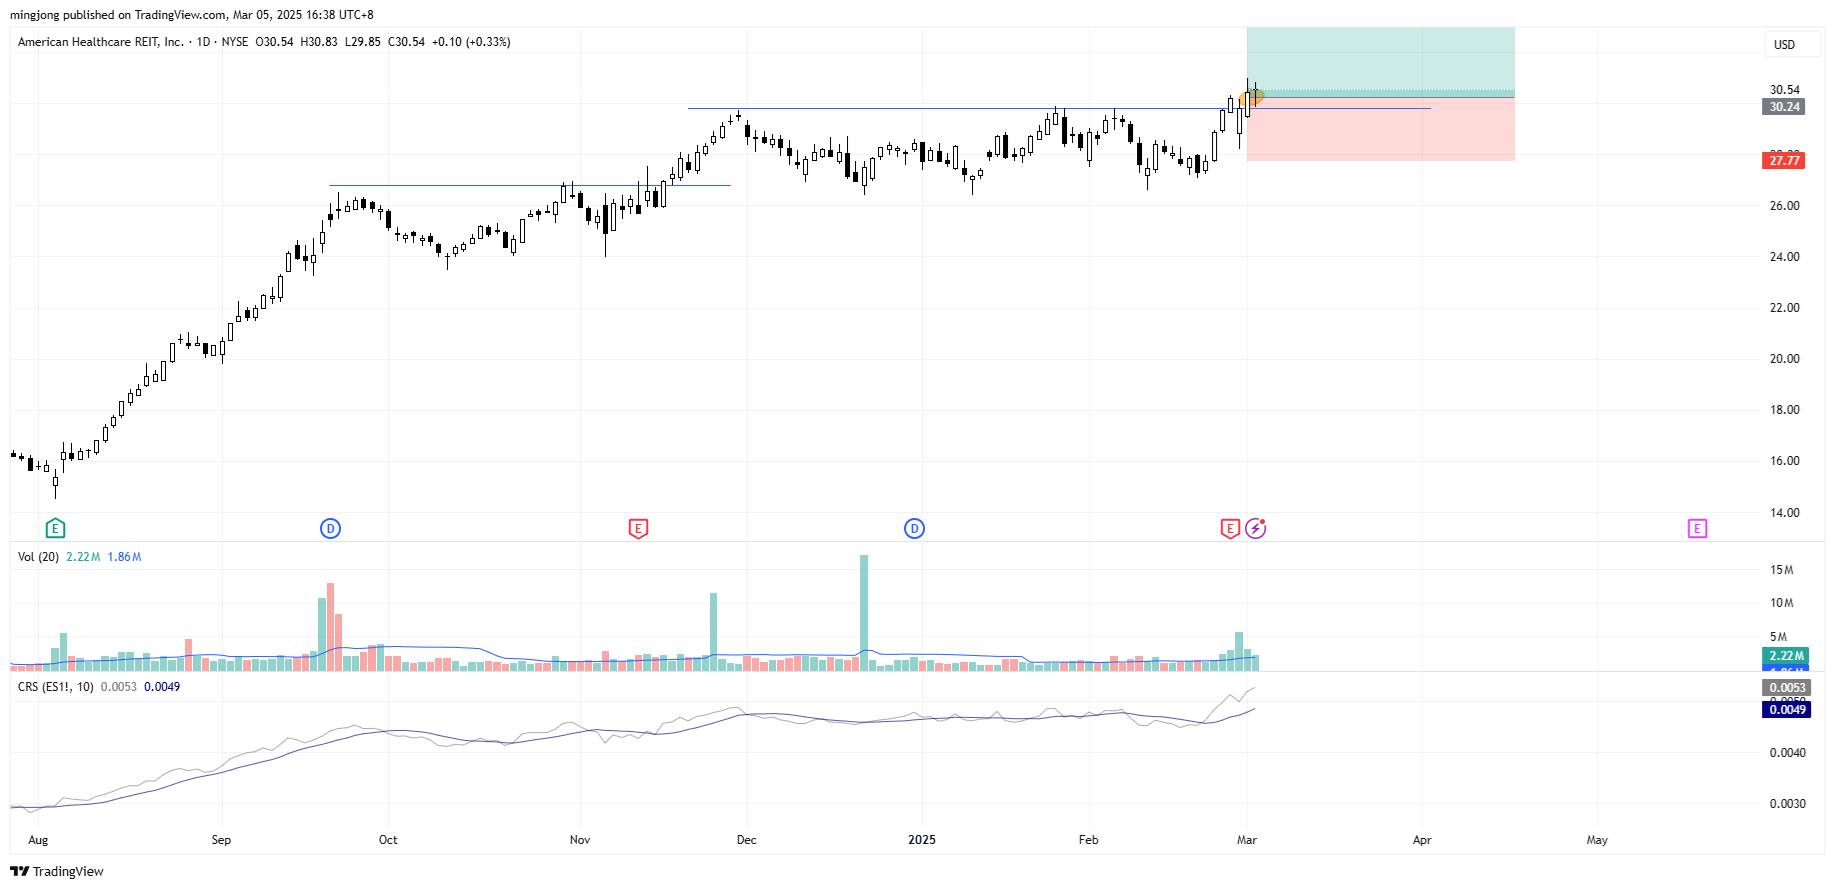
American Healthcare REIT (AHR)
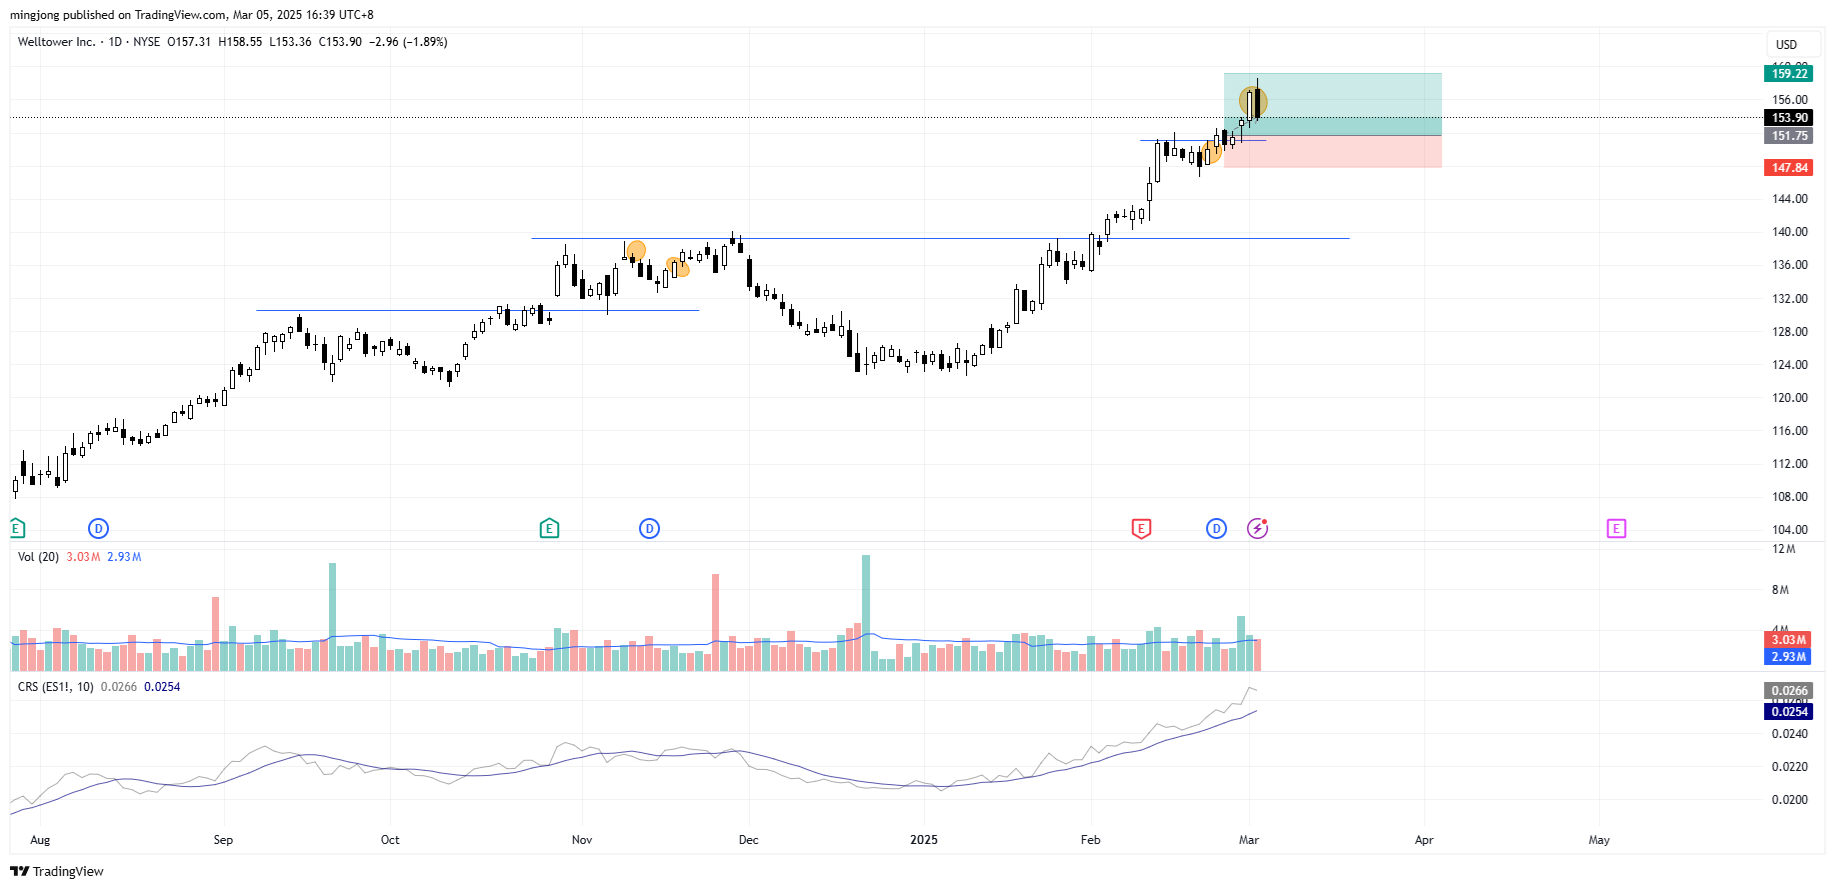
Welltower (WELL)
Author

Ming Jong Tey
Independent Analyst
Ming Jong Tey has been trading since 2008. He started his learning journey from technical analysis (indicators, Fibonacci, etc...) to value investing. Throughout his journey, he develops an interest in price action with chart pattern trading.


