Bank Nifty: Reversal at 51,404? – Nifty eyes 25,000 break
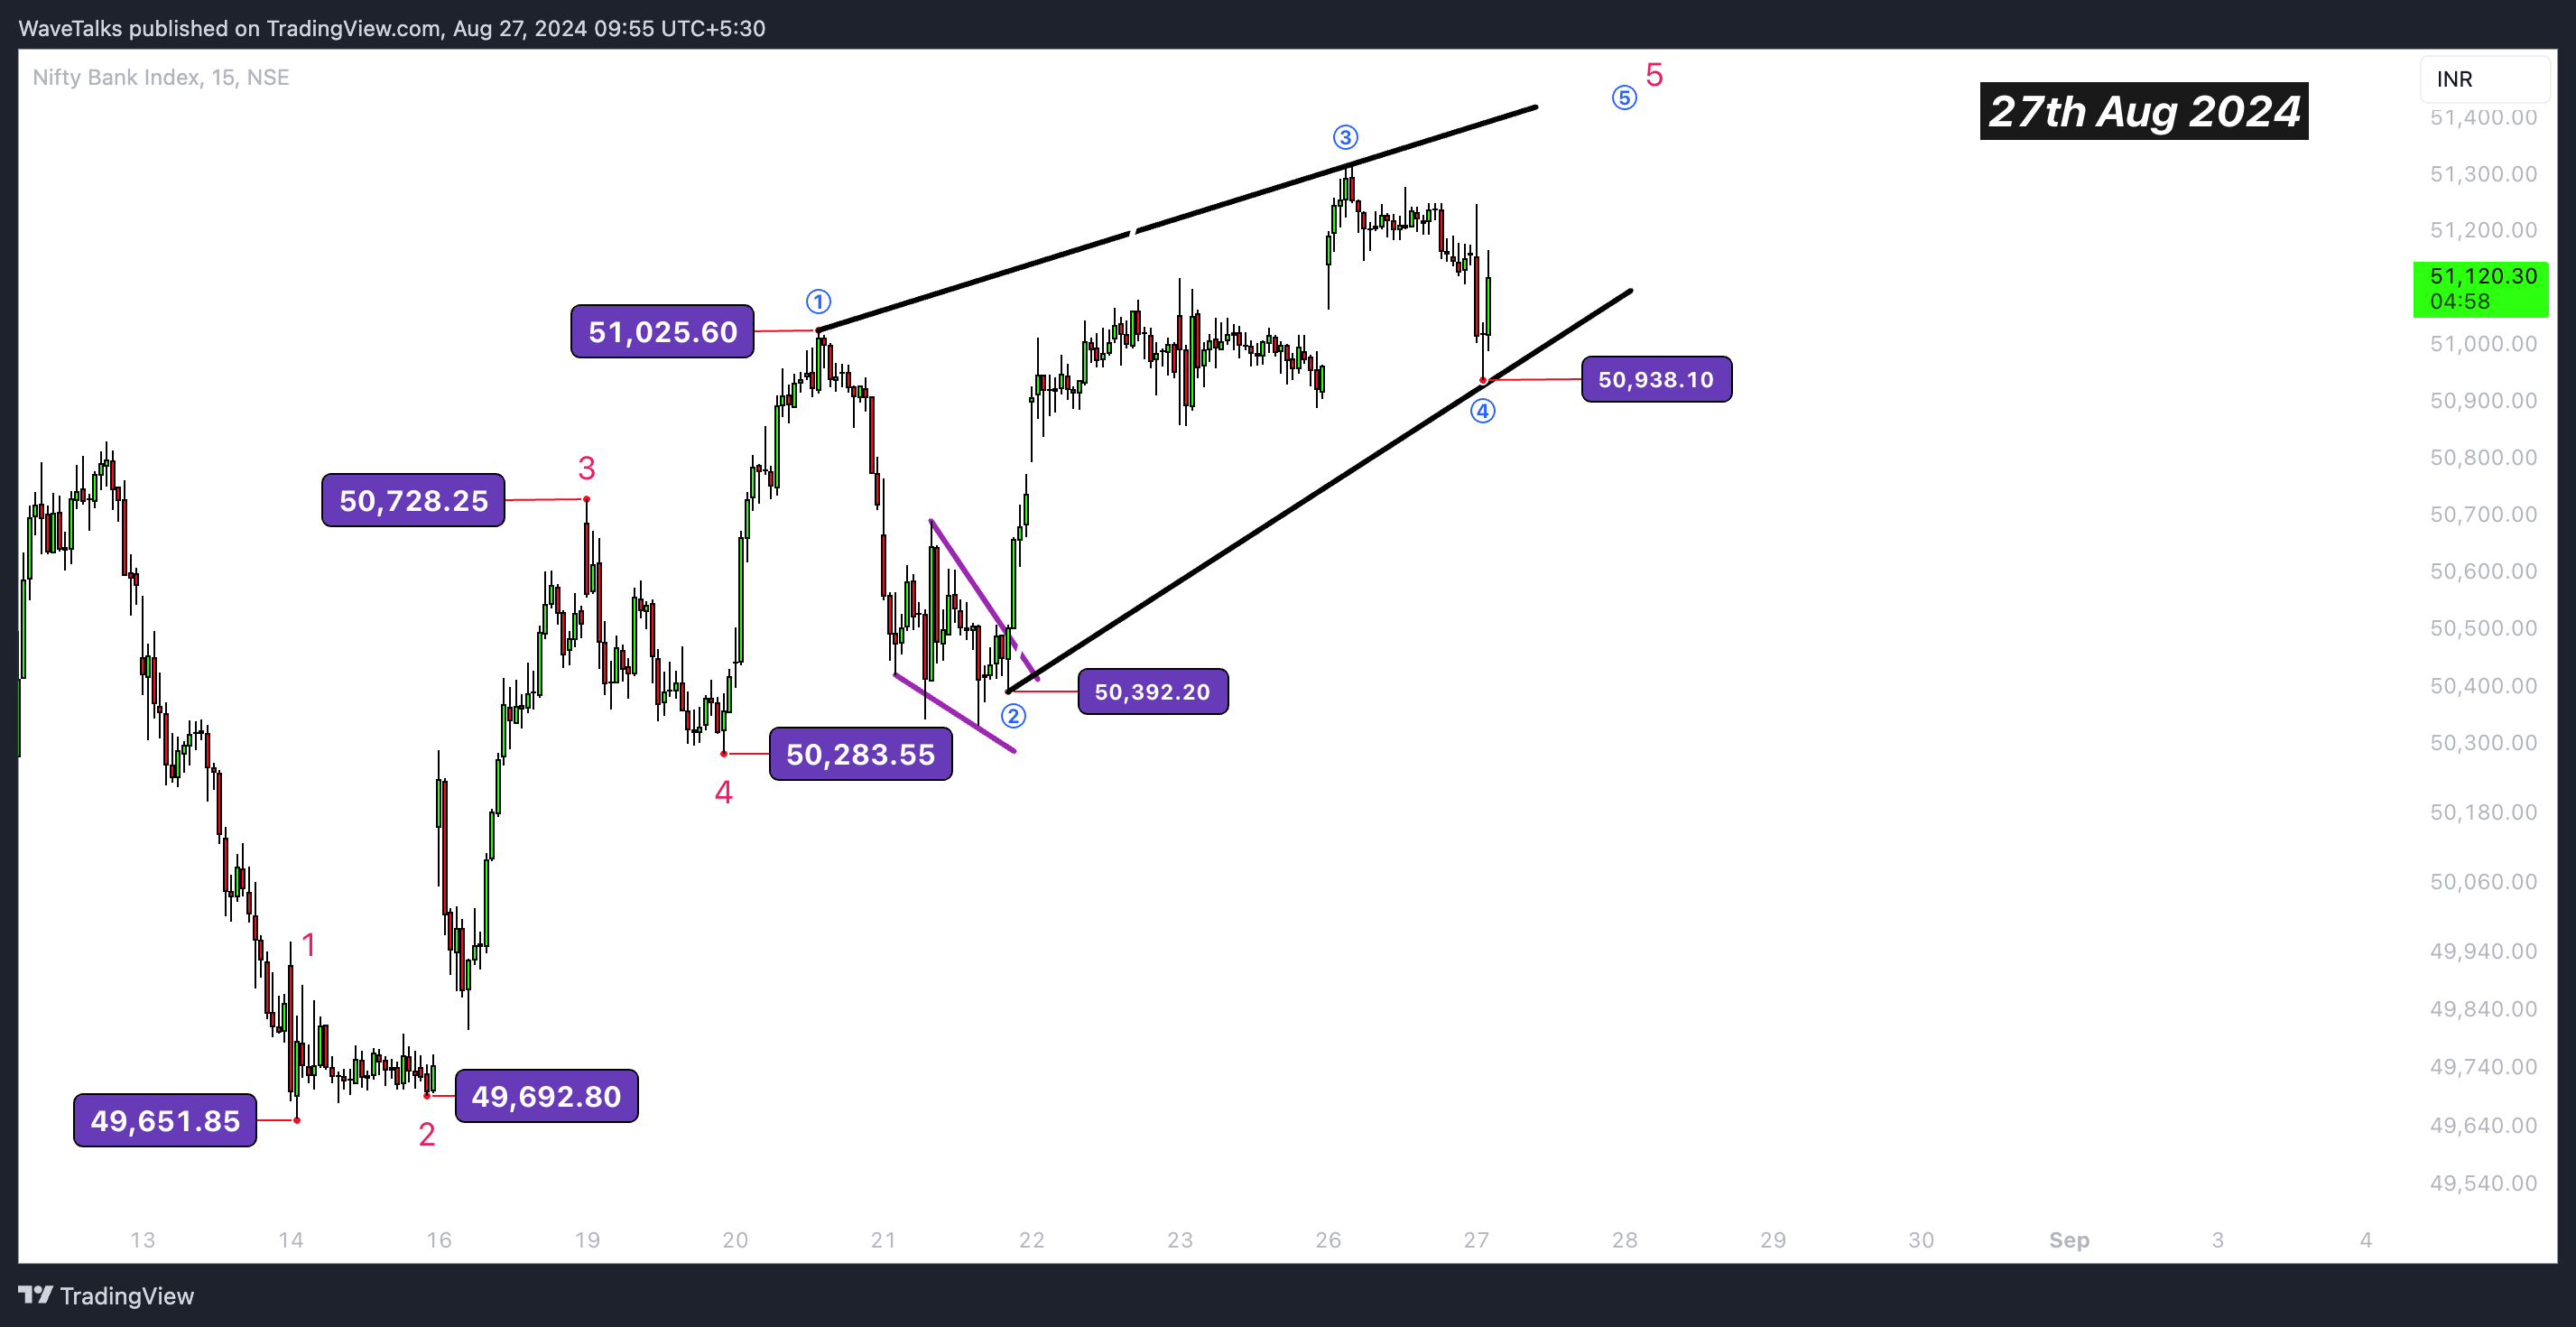
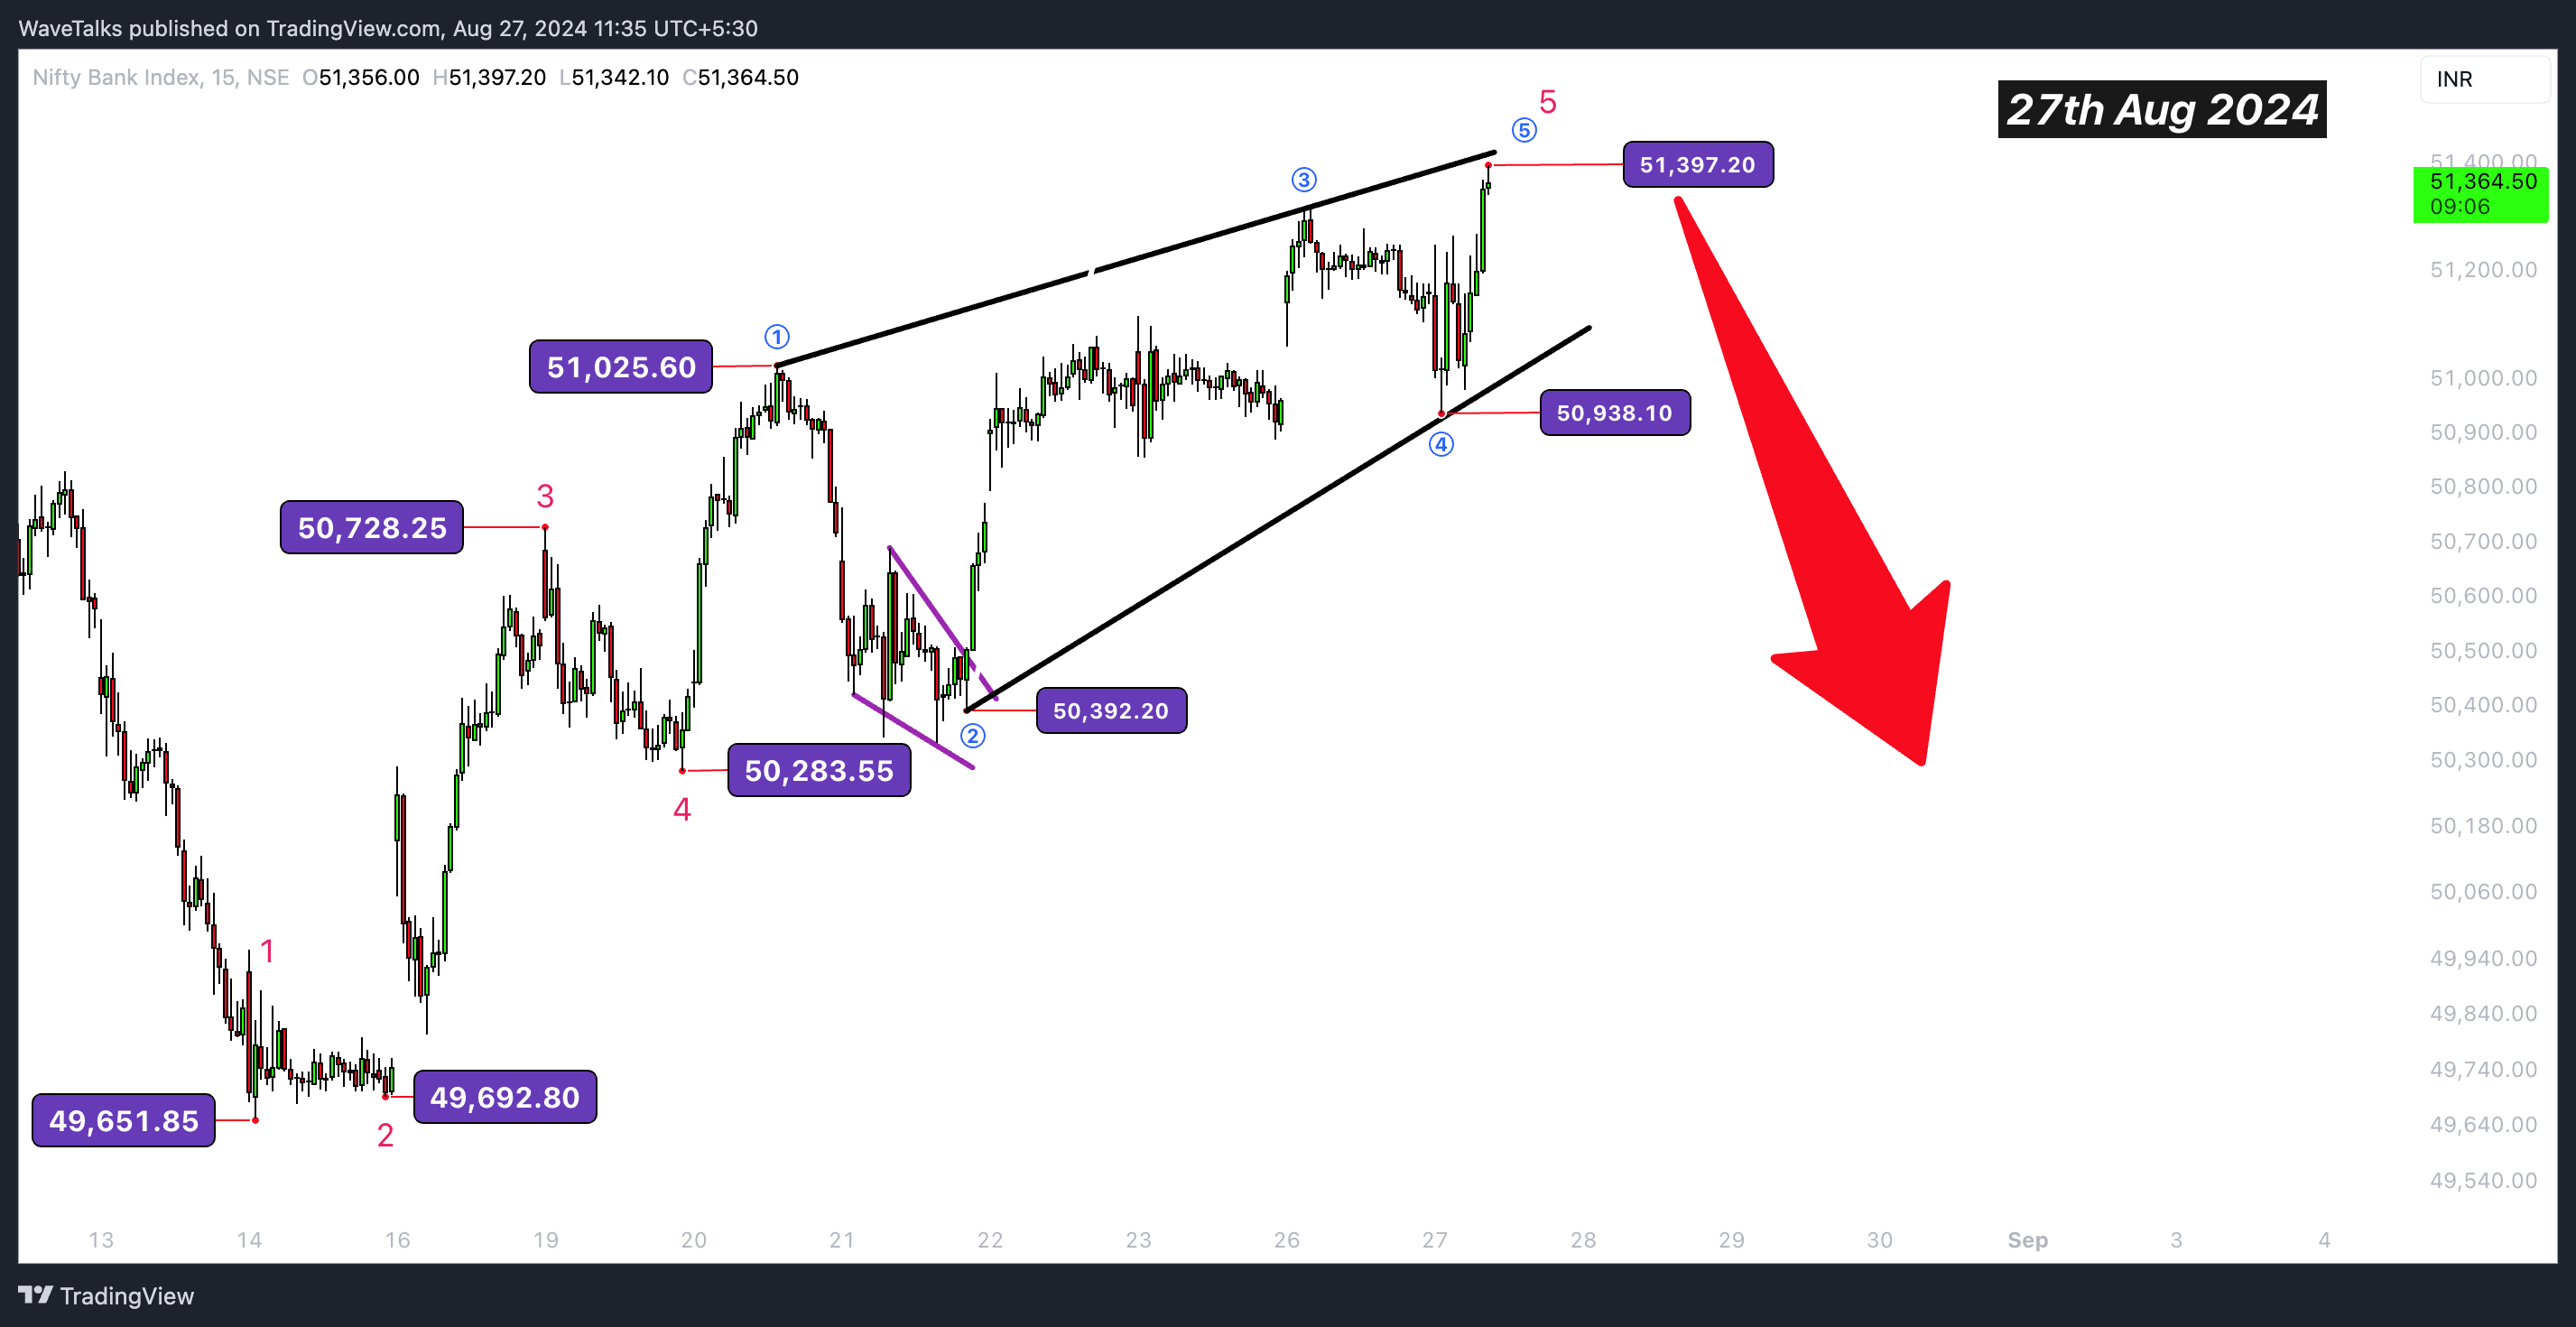
The Bank Nifty index has been rallying, but is this upward momentum about to hit a ceiling? The formation of an ending diagonal at the top of 51,404, which corresponds to 62% of the wave 1 distance (from 50,283 to 51,025), suggests that the current wave 5 may have reached its minimum objective. Safe traders should consider a negative bias, as a breach of the day's low at 50,939 could lead to a drop towards 50,283. This analysis dives into the potential reversal patterns forming in Bank Nifty and how bulls should prepare for the next wave.
Understanding the ending diagonal pattern: An ending diagonal is a pattern that often signals the end of a trend, typically forming in wave sequences. The recent rally from 50,939 to 51,404 as of 27th Aug 2024 may be the final push before a reversal. If the index fails to hold above the current high of 51,404, traders should watch for a close below 50,939, which could indicate a further decline towards 50,283.
Key levels to watch:
-
Current high: 51,404 (62% of wave 1).
-
Day's low: 50,939 (Critical Support Level or Wave 4 bottom).
-
Target: 50,283 (Next Logical Support on Breach - Wave 4 Higher Degree).
Nifty Index: Psychological level of 25,000 in danger? While Bank Nifty tests its limits, the Nifty Index is showing signs of weakening. Falling below the psychological level of 25,000 could be an early signal for bulls to exercise caution. A breakdown here may mark the beginning of a broader market correction, with potential repercussions for bullish positions.
Conclusion: As Bank Nifty hovers near a critical resistance level, the formation of an ending diagonal suggests that a trend reversal could be on the horizon. Safe traders should consider adopting a negative bias and monitor key support levels closely. The potential breach of the Nifty Index below 25,000 further underscores the need for caution in the coming sessions.
Author

Abhishek H. Singh
WaveTalks
Abhishek is a seasoned financial analyst with over a decade of experience specializing in Elliott Wave Theory.


