Bajaj Finserve Elliott Wave technical analysis [Video]
![Bajaj Finserve Elliott Wave technical analysis [Video]](https://editorial.fxstreet.com/images/TechnicalAnalysis/ChartPatterns/Chartism/stock-market-chart-79297425_XtraLarge.jpg)
BAJAJFINSV Elliott Wave technical analysis
Function: Larger Trend Higher (Intermediate degree Wave (5), orange).
Mode: Motive.
Structure: Impulse.
Position: Minor Wave 3 of intermediate Wave (5).
Details: Intermediate Wave (4) Orange completed as a triangle. Minor Wave 3 Grey of Intermediate Wave (5) underway also looks complete around 1920-30. If correct, expect a corrective Wave 4 before prices turn higher again. Alternatively, Wave 4 already completed above 1800 mark and Wave 5 Grey is progressing now.
Invalidation point: 1523.
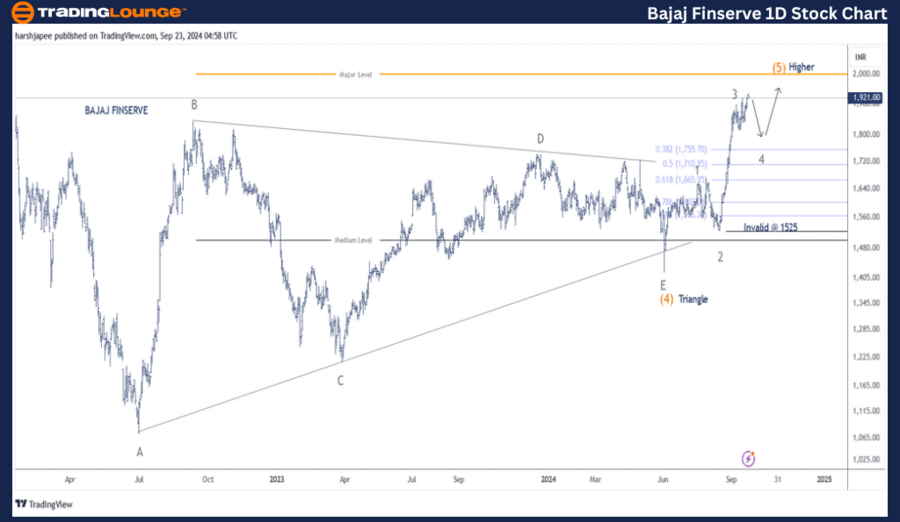
Bajaj Finserve daily chart technical analysis and potential Elliott Wave counts
Bajaj Finserve daily chart is indicating a progressive rally, which could be within its last wave; Intermediate Wave (5) Orange and potentially terminate around the 2100 mark. Immediate price support is seen at 1525, which is Minor Wave 2 Grey, termination.
Bajaj Finserve was unfolding a triangle as Intermediate Wave (4) Orange since July 2022, after printing lows around 1075 mark. The triangle sub divided within Minor Waves A through E and terminated around 1420 on June 04, 2024.
Intermediate Wave (5) Orange has been unfolding since then and Minor Waves 1, 2 and 3 look complete around 1660, 1525 and 1920-30 range respectively. If the above is correct, prices should ideally carve a sharp Wave 4, before proceeding higher.
BAJAJFINSV Elliott Wave technical analysis
Function: Larger Trend Higher (Intermediate degree Wave (5), orange).
Mode: Motive.
Structure: Impulse.
Position: Minor Wave 3 of intermediate Wave (5).
Details: Intermediate Wave (4) Orange completed as a triangle. Minor Wave 3 Grey of Intermediate Wave (5) underway also looks complete around 1920-30. If correct, expect a corrective Wave 4 before prices turn higher again. Alternatively, Wave 4 already completed above 1800 mark and Wave 5 Grey is progressing now. Potential target is seen through 2090 mark.
Invalidation point: 1523.
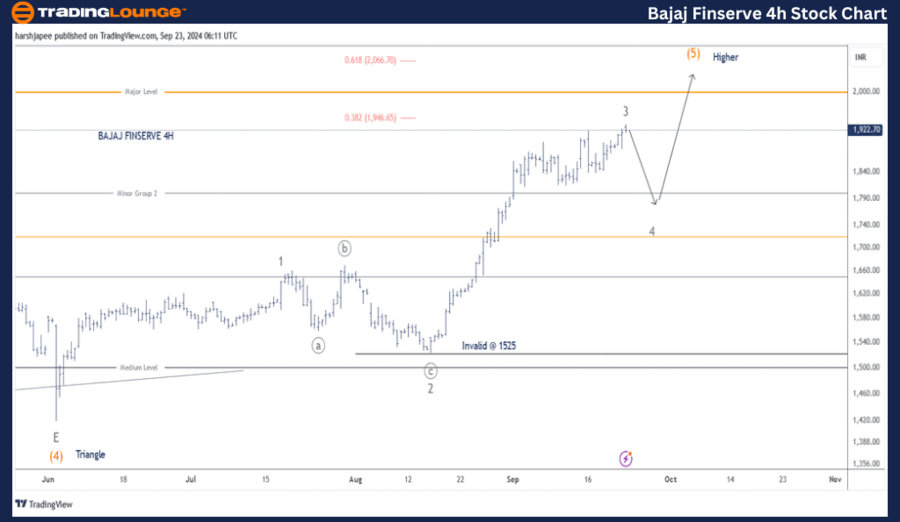
Bajaj Finserve four-hour chart technical analysis and potential Elliott Wave counts
Bajaj Finserve 4H chart highlights the wave structure since terminating Intermediate Wave (4) Orange around 1420. Please note Minor Wave 2 Grey unfolded as an expanded flat terminating around 1525 and Minor Wave 3 rallied through 1937 highs.
If correct, prices should drag lower through 1770-80 range before turning higher again towards 2100 mark to terminate Wave 5 Grey. Prices should ideally stay above 1525 going forward.
Conclusion
Bajaj Finserve is unfolding Minor Wave 4 Grey and terminate around 1770-80 range before turning higher again.
Bajaj Finserve Elliott Wave technical analysis [Video]
Author

Peter Mathers
TradingLounge
Peter Mathers started actively trading in 1982. He began his career at Hoei and Shoin, a Japanese futures trading company.


