Bajaj Finance Elliott Wave technical analysis
-
Function: Larger Degree Trend Higher (Intermediate Degree Orange).
-
Mode: Motive.
-
Structure: Impulse.
-
Position: Minor Wave 3 Grey.
-
Details: Minor Wave 3 Grey is advancing higher against 6460.
-
Invalidation point: 6460.
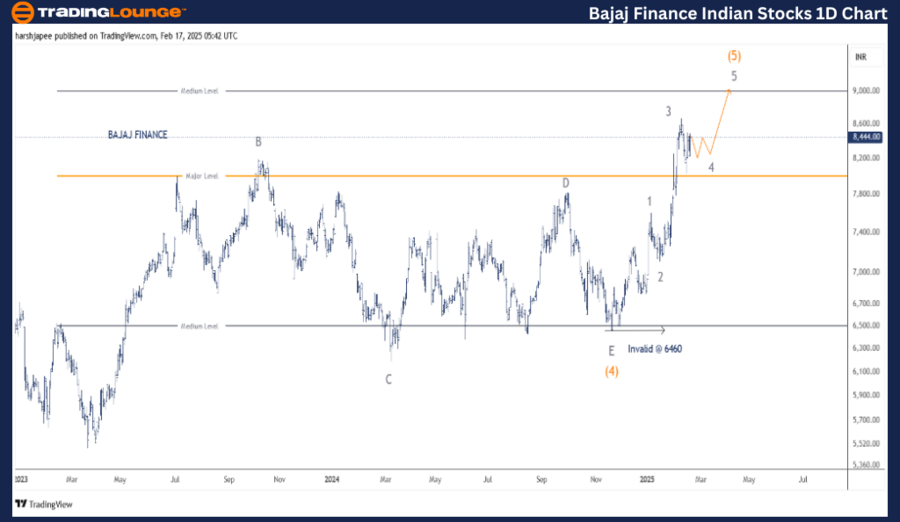
Bajaj Finance daily chart technical analysis and potential Elliott Wave counts
The BAJAJ FINANCE daily chart shows that bulls are driving prices higher towards at least 9000 levels, marking the completion of the larger degree uptrend (Intermediate Wave (5) Orange).
A potential Minor Wave 4 could be forming as an expanded flat or triangle before the final push higher. Previously, Intermediate Wave (4) ended around 6460 in November 2024, following a multi-year triangle that started in March 2023. Since then, Intermediate Wave (5) has been unfolding as an impulse, with the stock still having one more leg towards the 9000–9200 zone.
Bajaj Finance Elliott Wave technical analysis
-
Function: Larger Degree Trend Higher (Intermediate Degree Orange).
-
Mode: Motive.
-
Structure: Impulse.
-
Position: Minor Wave 3 Grey
-
Details: Minor Wave 3 Grey is advancing higher against 6460, potentially completing at 8665 or near completion. If correct, a triangle Wave 4 could be developing before Wave 5 pushes higher towards 9000 levels.
-
Invalidation Point: 6460.
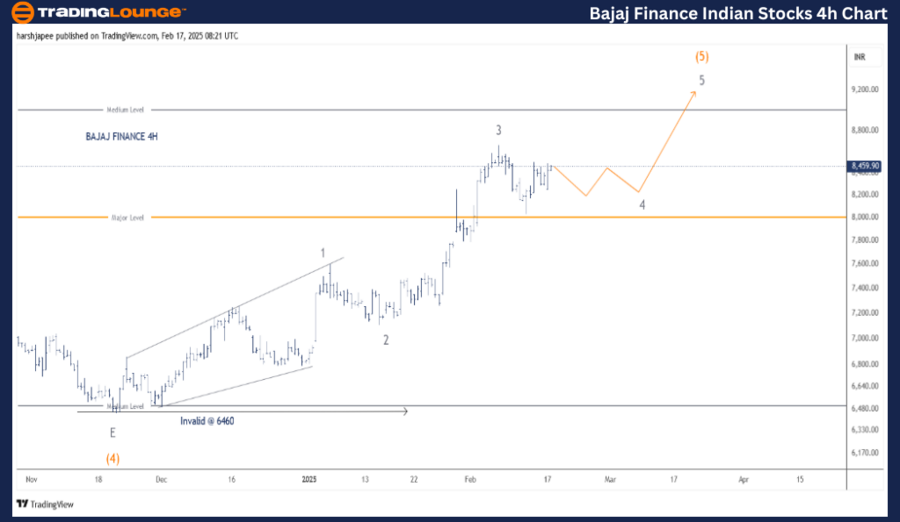
Bajaj Finance four-chart technical analysis and potential Elliott Wave counts
The BAJAJ FINANCE 4H chart highlights sub-waves within Intermediate Wave (5) Orange following the completion of Wave (4) as a triangle near 6460 in November 2024.
The thrust of Wave (5) is unfolding as an impulse, with a projection to break through the 9000 level swiftly.
- Minor Wave 1 formed as a leading diagonal, terminating around 7600.
- Wave 2 was a sharp correction, ending near 7120.
- Wave 3 pushed higher to 8665.
If this structure holds, Wave 4 may form a triangle before the final push. Prices must stay above 7600 for bulls to maintain the impulse wave.
Conclusion
BAJAJ FINANCE continues to progress higher within Minor Wave 3 of Intermediate Wave (5), aiming for 9000 levels in the coming sessions.
Bajaj Finance Elliott Wave technical analysis [Video]
As with any investment opportunity there is a risk of making losses on investments that Trading Lounge expresses opinions on.
Historical results are no guarantee of future returns. Some investments are inherently riskier than others. At worst, you could lose your entire investment. TradingLounge™ uses a range of technical analysis tools, software and basic fundamental analysis as well as economic forecasts aimed at minimizing the potential for loss.
The advice we provide through our TradingLounge™ websites and our TradingLounge™ Membership has been prepared without considering your objectives, financial situation or needs. Reliance on such advice, information or data is at your own risk. The decision to trade and the method of trading is for you alone to decide. This information is of a general nature only, so you should, before acting upon any of the information or advice provided by us, consider the appropriateness of the advice considering your own objectives, financial situation or needs. Therefore, you should consult your financial advisor or accountant to determine whether trading in securities and derivatives products is appropriate for you considering your financial circumstances.
Recommended content
Editors’ Picks

EUR/USD holds steady ahead of this week’s tariff showdown
EUR/USD flubbed a bullish run at the 1.0850 level on Monday, kicking off the new trading week on decidedly tepid footing. Investors are preparing for the newest round of tariff threats from US President Donald Trump.

AUD/USD regains traction toward 0.6300 after RBA Governor Bullock's presser
AUD/USD is marching back toward 0.6300 in Tuesday's Asian trading, capitalizing on RBA Governor Bullock's prudence amid global uncertainties. The Australian central bank warranted caution on the inflation outlook while maintaining the key rate at 4.1% earlier in the session.

Gold price extends bullish trend amid rising trade tensions; fresh record high and counting
Gold price continues to scale new record highs for the fourth straight day on Tuesday. Worries about the widening global trade war and geopolitical risks boost the commodity. Fed rate cut bets weigh on the USD and further benefit the non-yielding yellow metal.

PEPE could rally to double digits if it breaks above its key resistance level
Pepe memecoin approaches its descending trendline, trading around $0.000007 on Tuesday; a breakout indicates a bullish move ahead. Moreover, PEPE's long-to-short ratio supports a bullish thesis as bullish bets among the traders reach the highest over a month.

US: Trump's 'Liberation day' – What to expect?
Trump has so far enacted tariff changes that have lifted the trade-weighted average tariff rate on all US imports by around 5.5-6.0%-points. While re-rerouting of trade will decrease the effectiveness of tariffs over time, the current level is already close to the highest since the second world war.

The Best brokers to trade EUR/USD
SPONSORED Discover the top brokers for trading EUR/USD in 2025. Our list features brokers with competitive spreads, fast execution, and powerful platforms. Whether you're a beginner or an expert, find the right partner to navigate the dynamic Forex market.