Bajaj Finance Elliott Wave technical analysis [Video]
![Bajaj Finance Elliott Wave technical analysis [Video]](https://editorial.fxstreet.com/images/Macroeconomics/FlowFunds/Credit/stacked-credit-cards-gm480920118-69004297_XtraLarge.jpg)
BAJFINANCE Elliott Wave technical analysis
Function: Counter Trend (Minor Degree, Grey)
Mode: Corrective
Structure: Potential Impulse of Larger degree Correction
Position: Minor Wave 2 Grey
Details: Minor Wave 2 Grey extended through 7800 mark over the last week. A break below 7100 will confirm a top in place. Long traders should ideally take profits now and aggressive traders prepare to go short. Potential to turn lower from here against 8180-90. Potential Wave 3 Grey could be underway soon.
Invalidation point: 8180-90.
BAJAJ Finance chart technical analysis and potential Elliott Wave counts
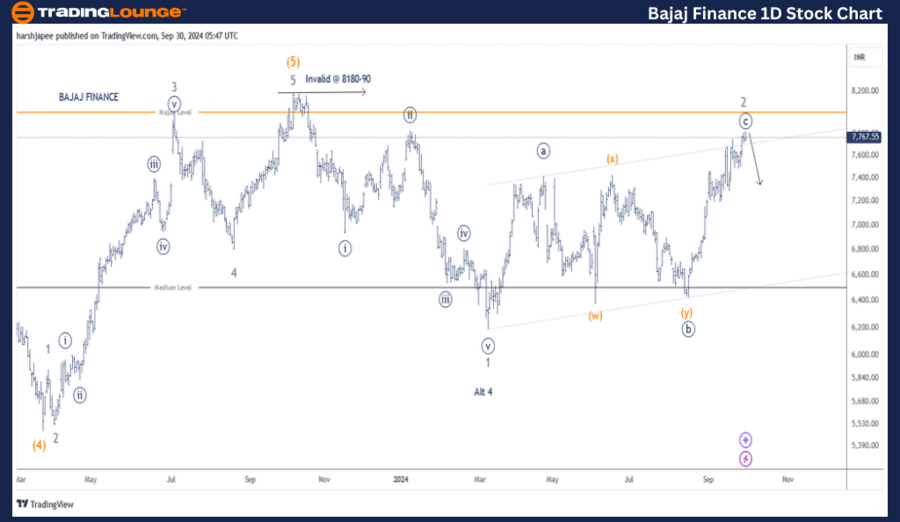
BAJAJ Finance daily chart is indicating a potential Minor Degree Corrective Lower is progressing since 8180-90 high registered in October 2023. Alternatively, the stock has terminated Minor Wave 4 around 6190 mark in March 2024 and could be unfolding Minor Wave 5 Grey since then.
High probable wave count suggests the stock terminated its Intermediate Wave (4) Orange around 5500 levels in March 2023. The stock rallied swiftly through 8180-90 range, carving an impulse and terminating Intermediate Wave (5) Orange by October 2023.
Since then, BAJAJ Finance is potentially unfolding a corrective wave (Zigzag) towards 5500 levels at least. It has carved Minor degree Waves 1 and 2 around 6200 and 7800-50 range respectively as marked here. If correct, prices should stay below 8190 mark and turn lower from here.
BAJFINANCE Elliott Wave technical analysis
Function: Counter Trend (Minor Degree, Grey).
Mode: Corrective.
Structure: Potential Impulse of Larger degree Correction.
Position: Minor Wave 2 Grey.
Details: Minor Wave 2 Grey extended through 7800 mark over the last week. A break below 7100 will confirm a top in place. Long traders should ideally take profits now and aggressive traders prepare to go short. Potential to turn lower from here against 8180-90. Potential Wave 3 Grey could be underway soon. The corrective Wave 2 Grey has also tested its Elliott Channel resistance above 7700-50.
Invalidation point: 8180-90.
BAJAJ Finance four-hour chart technical analysis and potential Elliott Wave counts
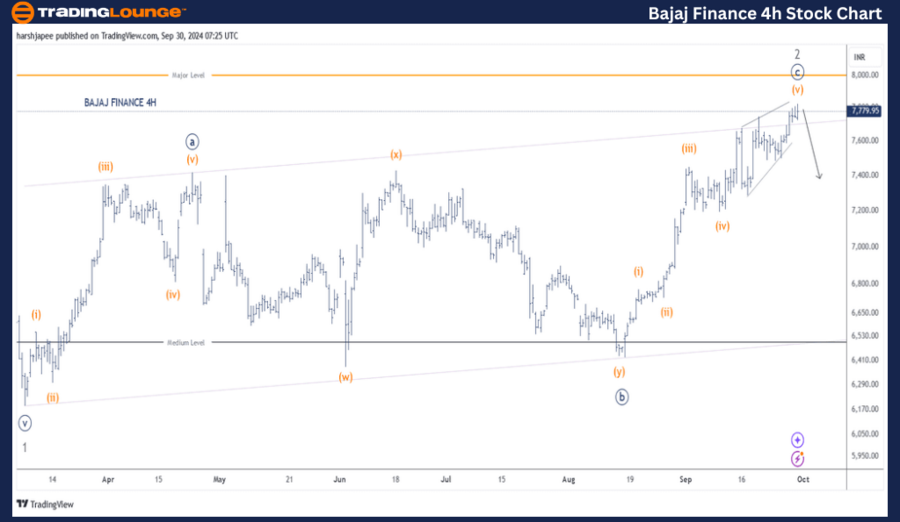
BAJAJ Finance 4H chart is highlighting the sub waves within Minor Wave 2 Grey, which looks complete around 7850. The structure could be seen as a Zigzag (5-3-5) marked as Minor Waves (a)-(b)-(c) between 6200 and 7850 levels respectively. If correct, Minor Wave 3 should be underway soon against 8190.
Conclusion
BAJAJ Finance is progressing within a larger degree corrective wave lower against 8190 mark.
Bajaj Finance Elliott Wave technical analysis [Video]
Author

Peter Mathers
TradingLounge
Peter Mathers started actively trading in 1982. He began his career at Hoei and Shoin, a Japanese futures trading company.


