Bajaj Auto Indian stocks Elliott Wave technical analysis [Video]
![Bajaj Auto Indian stocks Elliott Wave technical analysis [Video]](https://editorial.fxstreet.com/images/Markets/Equities/Industries/Automobiles/car-engine-637322356428414665_XtraLarge.jpg)
Bajaj Auto (one day chart) Elliott Wave technical analysis
Function: Counter Trend (Minor degree, Grey).
Mode: Corrective.
Structure: Impulse within larger degree corrective structure.
Position: Minor Wave 1 Grey.
Details: Minor Wave 1 is potentially complete around 9080 levels. If correct expect a counter trend rally to materialize soon to terminate Minor Wave 2 Grey.
Invalidation point: 12900.
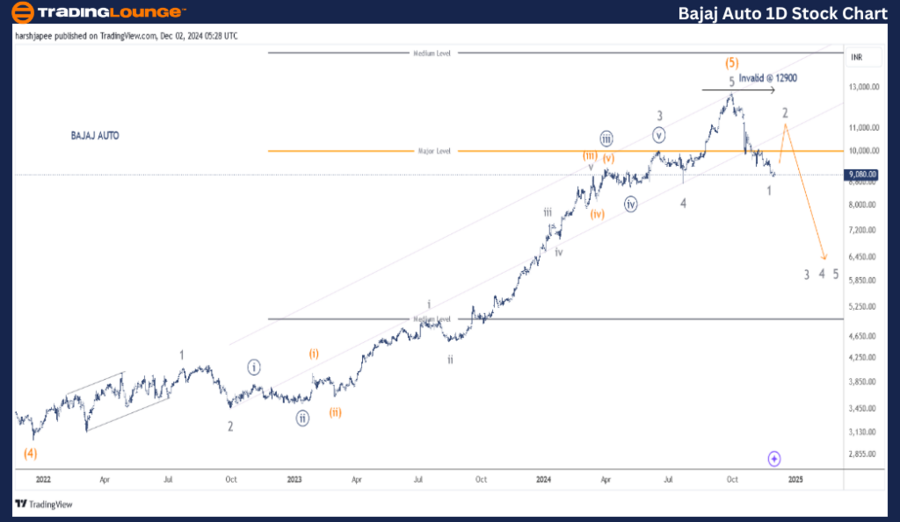
BAJAJ AUTO Daily Chart Technical Analysis and potential Elliott Wave Counts:
BAJAJ AUTO daily chart is indicating a potential high in place around 12900 mark terminating Intermediate Wave (5) Orange. Furthermore, prices have turned lower and carved an impulse wave reaching almost 9000 mark at the time of writing.
If the above is correct, the stock should produce a corrective rally against recent lows and reach through the 11000 mark in the next few trading sessions. Earlier, the stock had dropped through 3000-100 range around December 2021.
Since then, a five wave rally could be clearly seen as Minor Waves 1 through 5, reaching the 12900 mark. Bears have remained in control since then, dragging prices through 9000 levels. Expect a counter trend rally to materialize soon.
Bajaj Auto (four-hour chart) Elliott Wave technical analysis
Function: Counter Trend (Minor degree, Grey).
Mode: Corrective.
Structure: Impulse within larger degree corrective structure.
Position: Minor Wave 1 Grey.
Details: Minor Wave 1 is potentially complete around 9080 levels. If correct expect a counter trend rally to materialize soon to terminate Minor Wave 2 Grey.
Invalidation point: 12900.
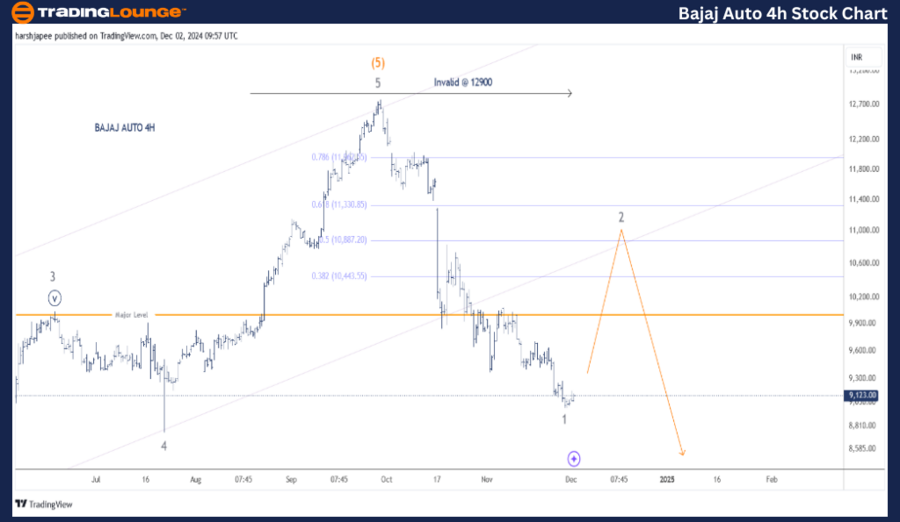
BAJAJ AUTO four-hour chart technical analysis and potential Elliott Wave counts:
BAJAJ AUTO 4H chart is highlighting the sub waves from Minor Wave 3 Grey, which terminated around 10100-200 zone in June 2024. Minor Wave 5 rallied through 12900 mark sub dividing into five waves. Furthermore, the drop from all-time highs has now reached 9000 levels at the time of writing.
It is pretty close to taking out previous Wave 4 of one lesser degree around 8770 mark. The initial drop between 12900 and 9000 levels is an impulse. If correct, a rally should soon resume from here to carve Minor Wave 2 Grey.
Conclusion:
BAJAJ AUTO has terminated Minor Wave 1 close to 9000 levels or is near to completion. Bulls should be preparing to come back in control to carve Minor Wave 2 Grey.
Elliott Wave analyst: Harsh Japee.
Bajaj Auto Elliott Wave technical analysis [Video]
Author

Peter Mathers
TradingLounge
Peter Mathers started actively trading in 1982. He began his career at Hoei and Shoin, a Japanese futures trading company.


