BAC rebounds from blue box, buyers hit easy target

Bank of America (BAC) is a leading U.S. financial institution, offering banking, wealth management, and corporate finance services. Its stock movements attract traders, making it a key player in market trends. BAC is still recovering from the 2008 financial crisis. After bottoming near $2.50 in May 2009, it has followed a bullish trajectory but has yet to reclaim its pre-crash high of $55 from November 2006. If the price breaks above its January/February 2022 high, a new peak could be within reach.
After recovery from the sell-off between February 2022 and October 2023, the stock has emerged into a clear bullish sequence. This bullish sequence should eventually breach the February 2022 high. Afterwards, a pullback should happen, correcting the entire bullish cycle from March 2009. However, before the expected pullback emerge, it will be interesting to know if the stock will take November 2006 high for a fresh record high. For now, we can at least expect one more 5-wave leg from the low of February 2025.
With this bias, we decided to continue to buy pullbacks in 3, 7 or 11 swing setups until the bullish cycle from March 2009 is exhausted. For Elliottwave-Forecast members, we indicate buying area with the blue box on our charts. On 6th December 2024, I made a post of the last blue box trade on this stock for that year. You can read the post by clicking. Price rebounded from the blue box to reach the expected targets. Meanwhile, shortly after price reached the target, another pullback emerged. We will discuss that below.
BAC Elliott Wave analysis 02.27.2025 update
A new pullback emerged from the high of 01.16.2025 and descended for over five weeks. We discovered a 7-swing corrective structure was emerging. Thus, we printed the blue box on the H4 chart where we advised members to go long at the first price of the box and stop a little below the last price. We shared the chart below on 02.27.2025.
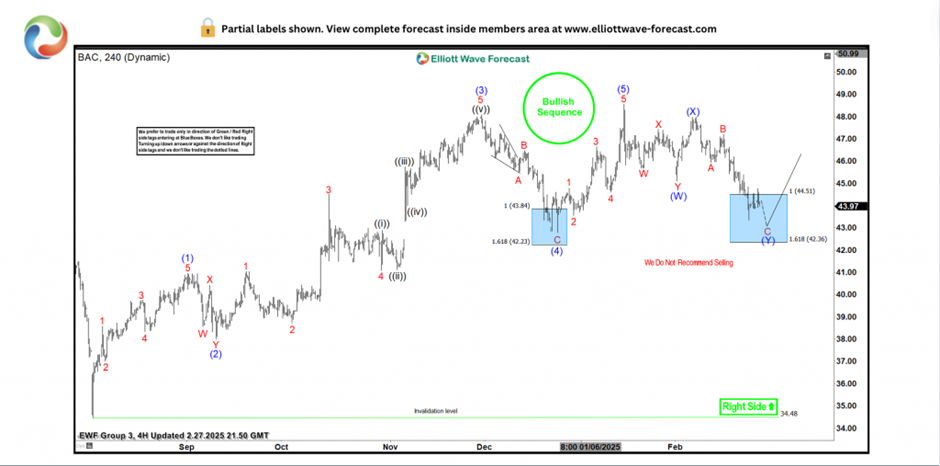
BAC (H4). Note: The higher degree counts have been removed.
From the blue box, we expected a 5-wave recovery to challenge and eventually breach the January/February 2022 high around $50. However, if a complete recovery doesn’t follow from the blue box, at least a 3-swing bounce should happen. With the 3-swing bounce, we can close half trade in profit and adjust the rest to breakeven. With that, we take some profit and take risk off the table. The chart below shows what happened next.
BAC Elliott Wave Analysis. 03.01.2025 Update
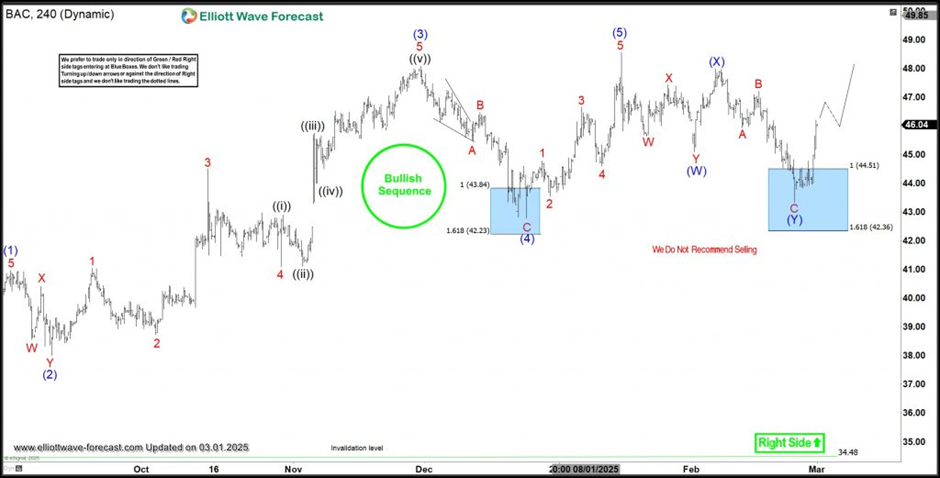
BAC (H4). Note: The higher degree counts have been removed.
The chart above shows a perfect reaction from the blue box where members went long. The sharp reaction shows a 5-wave bullish reaction is more likely to happen than not. However, at least, a 3-swing bounce has evolved above the risk-free price of 45.68. At 45.58, buyers have closed half of their position in profit and adjusted the rest to the breakeven price. This means some profit has been taken, no more risk left and there is a potential to make more profit. The coming days will be important for this stock. If the price completes a 5-wave rally from the blue box, we can reach the other target. Eventually, when the price breaches the January 2025 high, we can wait for the next 3/7/11 swing pullback and alert members to buy again from the blue box.
Author

Elliott Wave Forecast Team
ElliottWave-Forecast.com


