BABA stock: Forecasting the rally from the equal legs area

Hello fellow traders. In this technical blog we’re going to take a quick look at the Elliott Wave charts of BABA Stock, published in members area of the website. As our members know we have been forecasting the long side in Baba Stock in short term. Recently,we got a pull back that has made a clear 3 waves pull back that found buyers right at the equal legs area. In the further text we are going to explain the Elliott Wave forecast
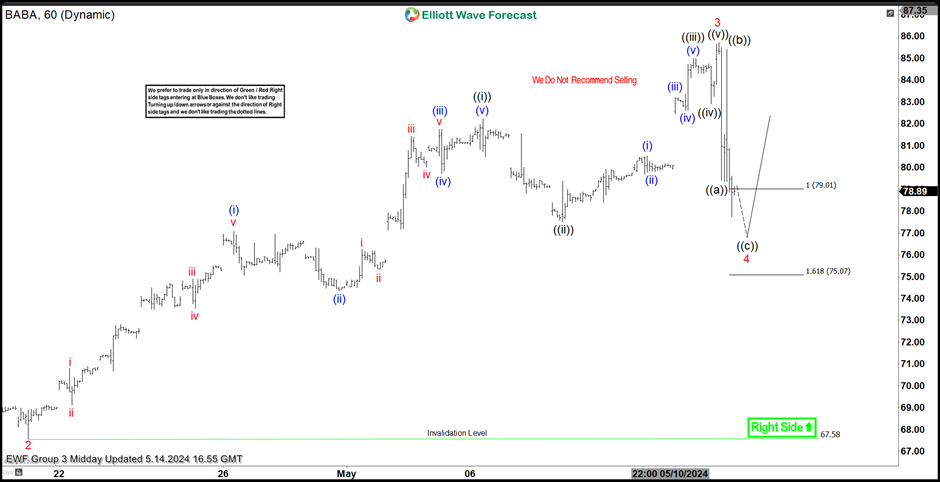
BABA one hour midday update 5.14.2024
Baba stock ended cycle from the 67.58 low as 5 waves structure. The stock is currently giving us pull back against that low. Equal legs area is already reached at 79.01-75.07. We are aware that pull back can complete any moment. We don’t recommend selling the stock and expect further rally to resume from the buyers zone : 79.01-75.07.
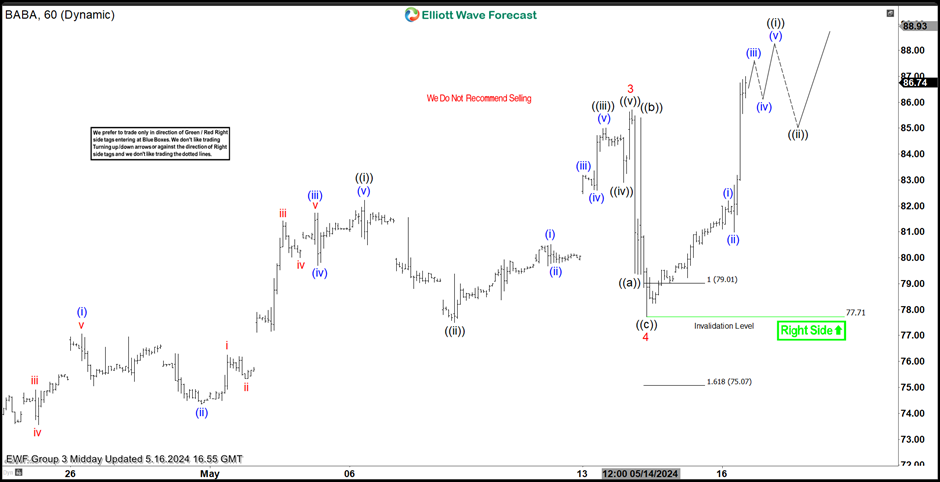
BABA one hour midday update 5.14.2024
Baba has given us nice rally from the marked extreme zone as expected. We count wave 4 red completed at 77.71 low. Rally made a break toward new highs confirming next leg up wave 5 is in progress. The first important tech zone comes at 87.74-90.74. From there we can see intraday pull back before further rally resumes. We don’t like short selling the stock and expect it to keep finding buyers in 3,7,11 swings as far as 77.71 pivot holds.
Keep in mind that market is dynamic and presented view could have changed in the mean time.
Author

Elliott Wave Forecast Team
ElliottWave-Forecast.com


