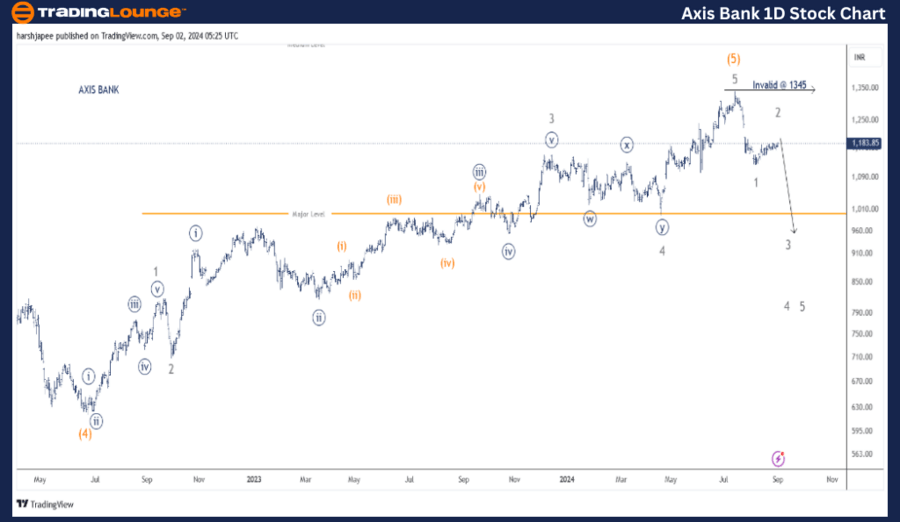
AXIS BANK LTD – AXISBANK (1D Chart) Elliott Wave/Technical Analysis

Function: Counter Trend (Minor degree, Grey. Wave A unfolding). 

Mode: Corrective. 

Structure: Potential Impulse. 

Position: Minor Wave 2 Grey of A complete. 

Details: Minor Wave 3 Grey should turn lower from here soon against 1345. 

Invalidation point: 1340-50.

Axis Bank Daily Chart Technical Analysis and potential Elliott Wave Counts:

Axis Bank daily chart is indicative of the larger degree trend complete around 1345 in July 2024. The stock might have terminated its fifth wave at multiple degree as marked on the chart here. If correct, a larger degree corrective wave is now underway against 1345. 

Axis Bank has been trending higher since its June 2022 low registered around 620 levels, also terminating intermediate Wave (4) Orange. The entire rally can be sub divided into five ways through 1345 mark, terminating Intermediate Wave (5). 

With the above structure holding well, prices should drag lower towards 998 levels in the medium term. This would confirm a much deeper correction ahead. Minor Waves 1 and 2 might be complete at the writing bears prepare to resume Wave 3 lower.

Chart

AXIS BANK LTD – AXISBANK (4H Chart) Elliott Wave/technical analysis

Function: Counter Trend (Minor degree, Grey. Wave A unfolding). 

Mode: Corrective. 

Structure: Potential Impulse. 

Position: Minor Wave 2 Grey of (A) complete. 

Details: Minor Wave 2 is either complete around 1190 or is near to completion. If correct, Minor Wave 3 Grey should turn lower from here. 

Invalidation point: 1340-50.

Axis Bank 4H Chart Technical Analysis and potential Elliott Wave Counts: 

Axis Bank 4H chart gives a closer look since Minor Wave 4 terminated around 998 mark in April 2024. The rally through 135 could be sub divided into five waves, terminating Minor Wave 5 Grey. If correct, prices should now stay below 1345 going forward. 

Furthermore, the stock might have produced its first impulse drop since 1345 highs around 1125 levels. Alternatively, Minute Wave ((iv)) is still unfolding with one more leg lower to complete Minor Wave 1 Grey. Either way, the stock should be under pressure until below 1345.

Chart

Conclusion

Axis Bank is expected to turn lower as Minor Wave 3 begins to unfold against 1345 highs.

Elliott Wave analyst: Harsh Japee.

AXIS BANK LTD – AXISBANK (4H Chart) Elliott Wave/technical analysis [Video]

Share: Feed news

As with any investment opportunity there is a risk of making losses on investments that Trading Lounge expresses opinions on.

Historical results are no guarantee of future returns. Some investments are inherently riskier than others. At worst, you could lose your entire investment. TradingLounge™ uses a range of technical analysis tools, software and basic fundamental analysis as well as economic forecasts aimed at minimizing the potential for loss.

The advice we provide through our TradingLounge™ websites and our TradingLounge™ Membership has been prepared without considering your objectives, financial situation or needs. Reliance on such advice, information or data is at your own risk. The decision to trade and the method of trading is for you alone to decide. This information is of a general nature only, so you should, before acting upon any of the information or advice provided by us, consider the appropriateness of the advice considering your own objectives, financial situation or needs. Therefore, you should consult your financial advisor or accountant to determine whether trading in securities and derivatives products is appropriate for you considering your financial circumstances.

Recommended content


Recommended content

Editors’ Picks

EUR/USD holds steady slightly above 1.1050

EUR/USD holds steady slightly above 1.1050

EUR/USD fluctuates in a narrow range slightly above 1.1050 on the first trading day of September. The US Dollar struggles to build on the previous week's gains as trading conditions remain thin, with US markets remaining closed on Labor Day.

EUR/USD News
GBP/USD trades in tight channel below 1.3150

GBP/USD trades in tight channel below 1.3150

GBP/USD moves sideways below 1.3150 in the second half of the day on Monday. Financial markets in the US remain closed in observance of the Labor Day holiday, not allowing the pair to make a decisive move in either direction.

GBP/USD News
Gold fluctuates at around $2,500 to start the week

Gold fluctuates at around $2,500 to start the week

Gold struggles to find direction on Monday as it continues to move up and down at around $2,500. Later in the week, key macroeconomic data releases from the US, including August PMI figures and the jobs report, could trigger the next big action in XAU/USD.

Gold News
Tron price is set for a decline as technical indicators show bearish momentum

Tron price is set for a decline as technical indicators show bearish momentum

Tron (TRX) retested its resistance barrier and declined 6.1% last week. In the Asian session on Monday, it trades at $0.1557. Tron's price action suggests a decline ahead, as the bearish divergence in technical indicators shows.

Read more
Week ahead: US labour data and the BoC rate announcement in focus

Week ahead: US labour data and the BoC rate announcement in focus

With US Federal Reserve Chair Jerome Powell’s recent speech at the Jackson Hole Symposium confirming that it is time to begin easing policy as well as underlining the importance of the jobs market, this week’s jobs data may help determine how the Fed approaches its easing cycle.

Read more
Moneta Markets review 2024: All you need to know

Moneta Markets review 2024: All you need to know

VERIFIED In this review, the FXStreet team provides an independent and thorough analysis based on direct testing and real experiences with Moneta Markets – an excellent broker for novice to intermediate forex traders who want to broaden their knowledge base.

Read More

Forex MAJORS

Cryptocurrencies

Signatures