Avery Dennison Corp. (AVY) Elliott Wave technical analysis [Video]
![Avery Dennison Corp. (AVY) Elliott Wave technical analysis [Video]](https://editorial.fxsstatic.com/images/i/Equity-Index_IBEX-2_XtraLarge.jpg)
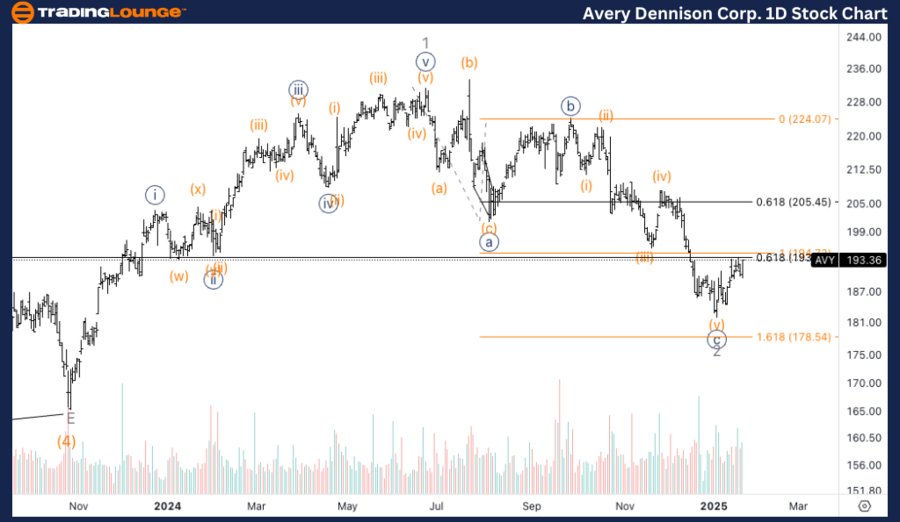
Avery Dennison Corp. (AVY) - Elliott Wave technical analysis
Daily chart analysis
-
Function: Counter-Trend.
-
Mode: Corrective.
-
Structure: Flat.
-
Position: Wave 2 of (5).
-
Direction: Potential bottom in wave 2.
-
Details: As the stock has surpassed the equality of {c} vs {a}, it is now approaching it again with increasing volume. A potential bottom could be in place, particularly if the stock moves back above the key $200 level.
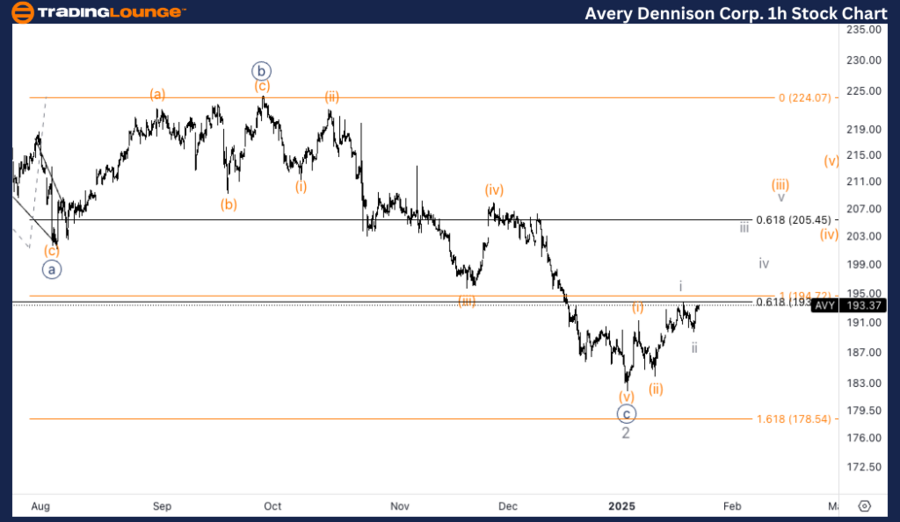
Avery Dennison Corp. (AVY) - Elliott Wave technical analysis
One-hour chart analysis
-
Function: Counter-Trend.
-
Mode: Corrective.
-
Structure: Flat.
-
Position: Wave (iii) of {i}.
-
Direction: Upside expected in wave {i}.
-
Details: The potential for an upside resumption is strong, with expectations of a sharp advance in the coming days. A support test above Trading Level 2 at $200 would provide additional confidence in the uptrend.
Summary
The analysis of Avery Dennison Corp. (AVY) includes both daily and 1-hour charts, leveraging Elliott Wave Theory to provide insight into market trends and potential price movements. The daily chart suggests a possible bottom formation, while the 1-hour chart anticipates further upside, contingent upon holding above key support levels.
Avery Dennison Corp. (AVY) Elliott Wave technical analysis [Video]
Author

Peter Mathers
TradingLounge
Peter Mathers started actively trading in 1982. He began his career at Hoei and Shoin, a Japanese futures trading company.


