AVY Elliott Wave technical analysis

Function: Counter trend.

Mode: Corrective.

Structure: Flat.

Position: Wave 2.

Direction: Bottom in wave 2.  

Details: Looking for a bottom in wave 2 soon, as we seem to be in an Intermediate wave (5) and have broken into ATH with the upside in wave 1 of (5).

AVY Elliott Wave technical analysis

Function: Counter trend.

Mode: Corrective.

Structure: Flat.

Position: Wave {c} of 2.  

Direction: Bottom in wave {c}.

Details: Looking for a bottom in {c}, as we have enter the aread between equality and 1.618 {c} vs. {a} which is where we would expect at least a bounce, in addition volume seems to be supporting a potential turn.

Welcome to our latest Elliott Wave analysis for Avery Dennison Corp. (AVY). This analysis provides an in-depth look at AVY's price movements using the Elliott Wave Theory, helping traders identify potential opportunities based on current trends and market structure. We will cover insights from both the daily and 4-hour charts to offer a comprehensive perspective on AVY's market behavior.

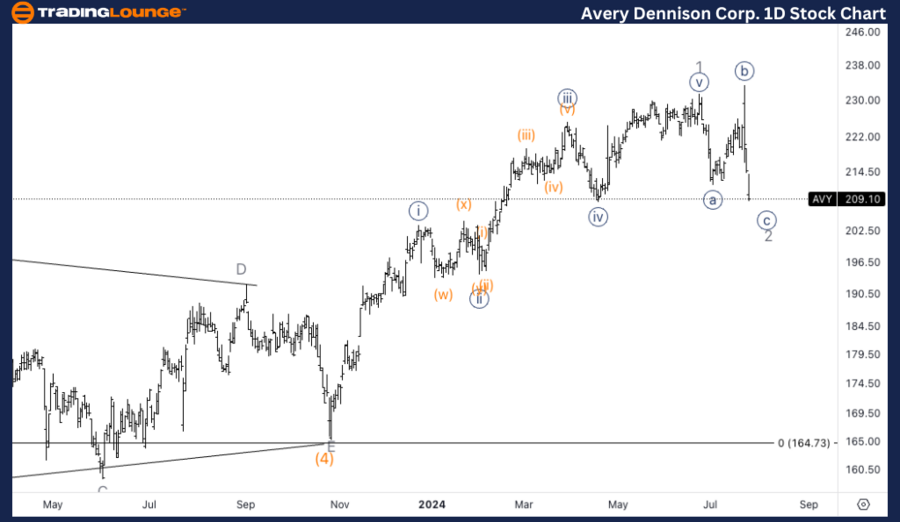
AVY Elliott Wave daily chart

The daily chart shows that AVY is approaching the bottom of wave 2 within an Intermediate wave (5). The price action indicates that wave 1 of (5) has already broken into an all-time high (ATH), which suggests strong bullish momentum. We are now looking for wave 2 to find its bottom soon, which would set the stage for the continuation of the upward trend in wave 3 of (5).

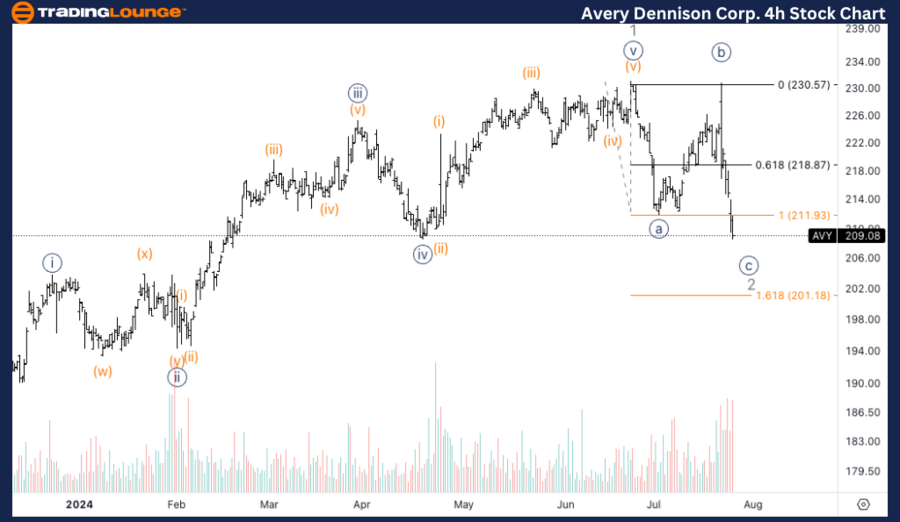
AVY Elliott Wave four hour chart

The 4-hour chart provides a closer look at wave {c} of 2, where the price has entered the area between equality and 1.618 times the length of wave {a}. This is a common target area for wave {c}, and the increased volume suggests a potential turn is near. Traders should watch for signs of a bottom formation in this area, which could lead to a significant bounce and the resumption of the overall uptrend.

AVY Elliott Wave technical analysis [Video]

Share: Feed news

As with any investment opportunity there is a risk of making losses on investments that Trading Lounge expresses opinions on.

Historical results are no guarantee of future returns. Some investments are inherently riskier than others. At worst, you could lose your entire investment. TradingLounge™ uses a range of technical analysis tools, software and basic fundamental analysis as well as economic forecasts aimed at minimizing the potential for loss.

The advice we provide through our TradingLounge™ websites and our TradingLounge™ Membership has been prepared without considering your objectives, financial situation or needs. Reliance on such advice, information or data is at your own risk. The decision to trade and the method of trading is for you alone to decide. This information is of a general nature only, so you should, before acting upon any of the information or advice provided by us, consider the appropriateness of the advice considering your own objectives, financial situation or needs. Therefore, you should consult your financial advisor or accountant to determine whether trading in securities and derivatives products is appropriate for you considering your financial circumstances.

Recommended content


Recommended content

Editors’ Picks

AUD/USD defends bid above 0.6550 amid renewed Mid-East tensions

AUD/USD defends bid above 0.6550 amid renewed Mid-East tensions

AUD/USD is holding recovery gains above 0.6550 in the Asian session on Monday. The US Dollar slips amid increased Fed rate cut bets and a firmer risk tone while the Aussie weighs escalating Middle East tensions ahead of an action-packed week. 

AUD/USD News

USD/JPY remains pressured around 154.50 as hawkish BoJ bets offset risk-flows

USD/JPY remains pressured around 154.50 as hawkish BoJ bets offset risk-flows

USD/JPY stays under pressure around 154.50 early Monday, as heightened odds of a BoJ rate hike this week offset Middle East worries and a broad US Dollar softness. All eyes remain on the BoJ and Fed policy announcements, which are due later this week. 

USD/JPY News

Gold price trades with mild positive bias; lacks bullish conviction amid risk-on mood

Gold price trades with mild positive bias; lacks bullish conviction amid risk-on mood

Gold price once again showed some resilience below the 50-day SMA on Friday and staged a modest recovery from the vicinity of over a two-week low touched the previous day. The move up followed the release of the US Personal Consumption Expenditures Price Index.

Gold News

Crypto weekly flashback and best trades for the week

Crypto weekly flashback and best trades for the week

Meme coins showed mixed results in the past week. Dogecoin, Shiba Inu and Pepe started their recovery early on Sunday while Dogwifhat and Bonk extend losses.

Read more

Investors hoping for a better week

Investors hoping for a better week

Global markets will try their best to get into a better mood after contending with a tough wave of risk off flow in the previous week. Key standouts on Monday’s calendar come from UK consumer credit, mortgage approvals, and CBI trades, along with Dallas Fed manufacturing.

Read more

Forex MAJORS

Cryptocurrencies

Signatures