Avery Dennison Corp. (AVY) Elliott Wave technical analysis [Video]
![Avery Dennison Corp. (AVY) Elliott Wave technical analysis [Video]](https://editorial.fxstreet.com/images/TechnicalAnalysis/ChartPatterns/Candlesticks/stock-market-graph-and-bar-chart-price-display-75053099_XtraLarge.jpg)
AVY Elliott Wave technical analysis
Function: Trend.
Mode: Impulsive.
Structure: Motive.
Position: Wave {iii} of 5.
Direction: Upside in wave {iii}.
Details: Looking for upside into wave 5, equality of 5 vs. 3 which in this case will stand as invalidation level, as wave 3 is currently shorter than 1, stands at 250$.
AVY Elliott Wave technical analysis – Daily chart
In our Elliott Wave analysis of Avery Dennison Corp. (AVY), we observe an impulsive trend pattern characterized by a motive structure. AVY is currently positioned in wave {iii} of 5, indicating a continuation higher within this wave sequence. The target level for the upside movement into wave 5 is the equality of wave 5 vs. wave 3, which stands at the $250 level. This target also acts as the invalidation level, as wave 3 is currently shorter than wave 1. Traders should monitor this level closely as it provides a critical threshold for potential wave completion and validation of the current wave structure.
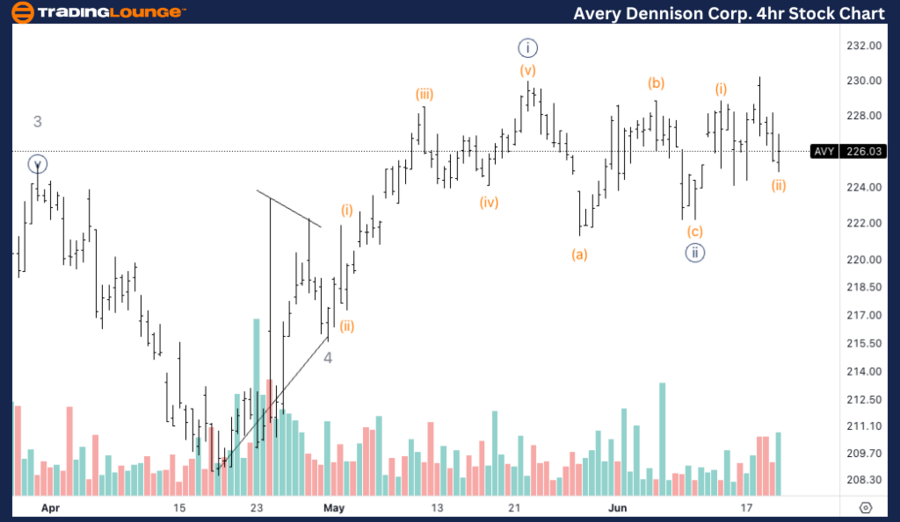
AVY Elliott Wave technical analysis
Function: Trend
Mode: Impulsive
Structure: Motive
Position: Wave (ii) of {iii}.
Direction: Upside {iii}.
Details: Looking for minute wave {iii} to start unfolding, otherwise we could be in either a top in place, or else we could be forming an ending diagonal in wave 5.
AVY Elliott Wave technical analysis – Four-hour chart
On the 4-hour chart, AVY continues to follow an impulsive trend mode within a motive structure, specifically in wave (ii) of {iii}. The current analysis suggests an anticipated unfolding of minute wave {iii}, which would indicate further upside potential. However, if this wave does not start unfolding as expected, it could suggest that a top might already be in place, or alternatively, we could be forming an ending diagonal in wave 5.
This potential scenario should be watched for confirmation or invalidation to adapt trading strategies accordingly.
Welcome to our latest Elliott Wave analysis for Avery Dennison Corp. (AVY). This analysis provides an in-depth look at AVY's price movements using the Elliott Wave Theory, helping traders identify potential opportunities based on current trends and market structure. We will cover insights from both the daily and 4-hour charts to offer a comprehensive perspective on AVY's market behavior.
Avery Dennison Corp. (AVY) Elliott Wave technical analysis [Video]
Author

Peter Mathers
TradingLounge
Peter Mathers started actively trading in 1982. He began his career at Hoei and Shoin, a Japanese futures trading company.


