|

AUDUSD Price Analysis: Negative divergence triggers a bearish reversal, bears are hopeful below 0.6700

  • A shift of market sentiment into a negative trajectory has weakened risk-perceived currencies.
  • The breakdown of the symmetrical triangle and activation of negative divergence has underpinned the Greenback.
  • The 20-EMA is acting as a major hurdle for the asset.

The AUDUSD pair has delivered a downside break of the consolidation formed in a narrow range of 0.6716-0.6750 in the Tokyo session. The asset has sensed selling pressure as investors’ risk appetite has trimmed dramatically.

A recovery experienced in S&P500 futures in Asia is fading now. Meanwhile, the US dollar index (DXY) is oscillating near its immediate hurdle of 106.60. The 10-year US Treasury yields have also recovered to near 3.73%.

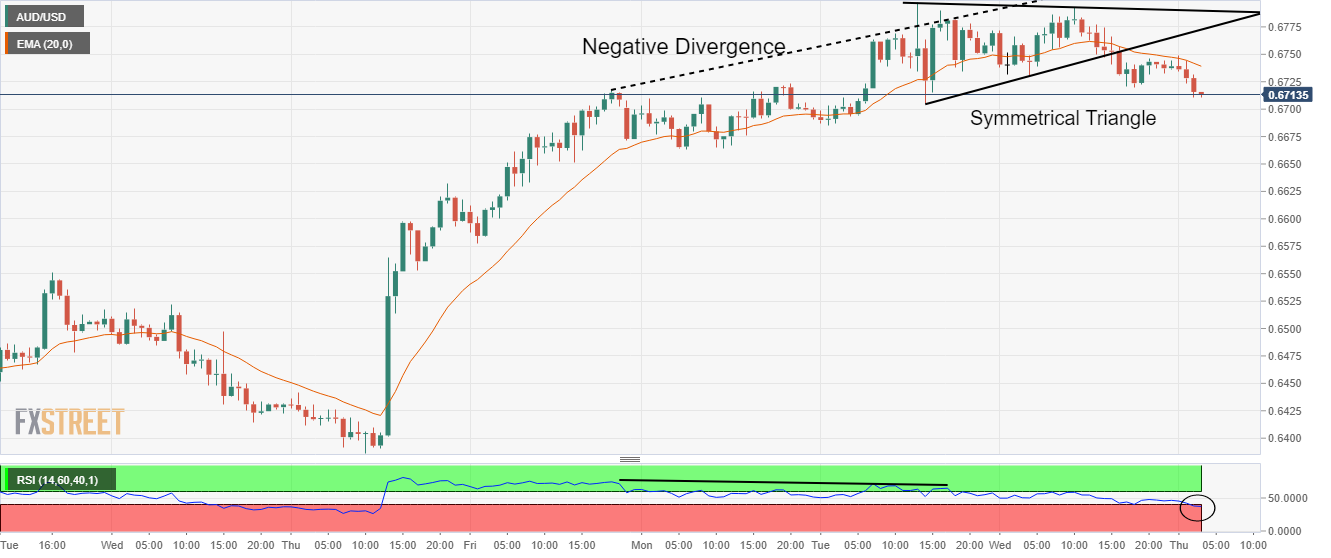
On an hourly scale, the asset has witnessed an expansion in volatility after a downside break of the Symmetrical Triangle formed around Tuesday’s high at 0.6800. Earlier, the major displayed a loss in the upside momentum after a formation of bearish negative divergence. The asset was continuously forming higher highs while the momentum oscillator, Relative Strength Index (RSI) (14) formed a lower high. Also, the RSI (14) has shifted into the bearish range of 20.00-40.00, which indicates that the downside momentum has been activated.

The asset has also surrendered the cushion of the 20-period Exponential Moving Average (EMA), which signals that the short-term trend is bearish now.

A decisive move below the round-level support of 0.6700 will rag the asset towards Monday’s low at 0.6663, followed by November 8 high at 0.6550.

On the flip side, the Aussie bulls could regain traction if the asset recaptures Tuesday’s high near 0.6800. An occurrence of the same will drive the asset towards September 13 high around 0.6900 and a psychological resistance of 0.7000.

AUDUSD hourly chart

AUD/USD

Overview
Today last price0.67
Today Daily Change-0.0043
Today Daily Change %-0.64
Today daily open0.6743
 
Trends
Daily SMA200.6478
Daily SMA500.65
Daily SMA1000.6699
Daily SMA2000.6952
 
Levels
Previous Daily High0.6793
Previous Daily Low0.672
Previous Weekly High0.6717
Previous Weekly Low0.6387
Previous Monthly High0.6548
Previous Monthly Low0.617
Daily Fibonacci 38.2%0.6748
Daily Fibonacci 61.8%0.6765
Daily Pivot Point S10.6711
Daily Pivot Point S20.6679
Daily Pivot Point S30.6638
Daily Pivot Point R10.6784
Daily Pivot Point R20.6825
Daily Pivot Point R30.6857

Author

Sagar Dua

Sagar Dua

FXStreet

Sagar Dua is associated with the financial markets from his college days. Along with pursuing post-graduation in Commerce in 2014, he started his markets training with chart analysis.

More from Sagar Dua
Share:

Editor's Picks

EUR/USD slumps below 1.1750 as USD benefits from risk-aversion

EUR/USD comes under renewed bearish pressure in the European session and trades below 1.1750 following a recovery attempt earlier in the day. The US Dollar gathers strength and weighs on the pair as investors seek refuge in the wake of Israel and the United States' joint attack on Iran.

GBP/USD targets 1.3500 barrier near moving averages

GBP/USD rebounds from the daily losses, trading around 1.3450 during the Asian hours on Monday. The technical analysis of the daily chart indicates an ongoing bearish bias, as the pair trades within a descending channel pattern.

Gold surges on safe-haven demand, rises above $5,400

Gold benefits from intense risk-aversion on Monday and climbs above $5,400, setting a fresh monthly-high in the process. Tensions in the Middle East remain high as Israel and Hezbollah continue to exchange strikes following the US-Israel joint attack on Iran over the weekend.

Bitcoin, Ethereum and Ripple under pressure as key supports face breakdown risk

Bitcoin, Ethereum, and Ripple prices trade on the back foot at the start of this week on Monday, after extending losses in the previous week. BTC is on the brink of a breakdown, ETH is capped below key resistance, and XRP risks a crack of the trendline.

The market is paying for insurance, not apocalypse

As expected, this morning felt less like a Monday market open and more like a fire drill. Futures screens flickered red. S&P contracts down almost 1%. Nasdaq off 1.2%. Brent leaped 13% through $80. Gold rose 1.6% toward $5350 before paring some gains. The dollar is strutting mildly. The Swiss franc is quietly doing what it always does in a storm, catching some safe-haven flows.

Pi Network Price Forecast: Core team offloads supply, weighing on PI recovery

Pi Network  hovers below $0.1700, broadly steady at press time on Monday, attempting a recovery after a 2% loss the previous day. Sunday’s decline aligned with nearly 49 million PI tokens offloaded by the Pi Foundation, implying a spike in supply pressure that capped the prevailing four-day recovery.