AUD/USD falls back below 0.6400 ahead of RBA rate call
- AUD/USD sees Monday declines as market risk appetite sours.
- RBA rate call in the pipe for Tuesday.
- Market sentiment set to be titled to the downside for NFP week.

The AUD/USD is washing back into familiar lows for Monday, trading into 0.6340 as broad-market sentiment turns risk-off.
The Aussie (AUD) is down 1.2% from Monday's early high of 0.6445 and off of the day's opening bids by around 65 pips. Market flows are broadly favoring the US Dollar (USD) as investors get spooked by fears of a global economic slowdown.
US ISM Purchasing Manager Index (PMI) figures came in mixed on Monday, limiting Greenback support to safe haven market flows. The US Manufacturing PMI ticked from the previous 47.6 to 49, but prices paid by manufacturers declined, printing at 43.8 versus the expected uptick to 48.6.
Tuesday brings the latest rate call from the Reserve Bank of Australia (RBA), which will be tabled by the RBA's new head, Governor Michele Bullock will be making her debut appearance as the head of the RBA, and investors are broadly anticipating the RBA holding rates steady at 4.1%.
Markets are still anticipating one more rate hike from the RBA, likely due in November, and investors will be keeping a close eye on the RBA rate statement for any clues about the Australian central bank's path forward.
The RBA rate call lands on Tuesday at 03:30 GMT.
Read More:
RBA Preview: Forecasts from eight major banks, no change in rates, hiking in November?
RBA expected to keep rates unchanged – UOB
Mixed data docket for the week heading into NFP Friday
Australian Trade Balance figures land on Thursday, with the RBA's latest Financial Stability Review on Friday. Friday's action is set to be entirely overshadowed by US Non-Farm Payrolls. Forecasts see the NFP for September printing a decline from 187K to 163K.
AUD/USD technical outlook
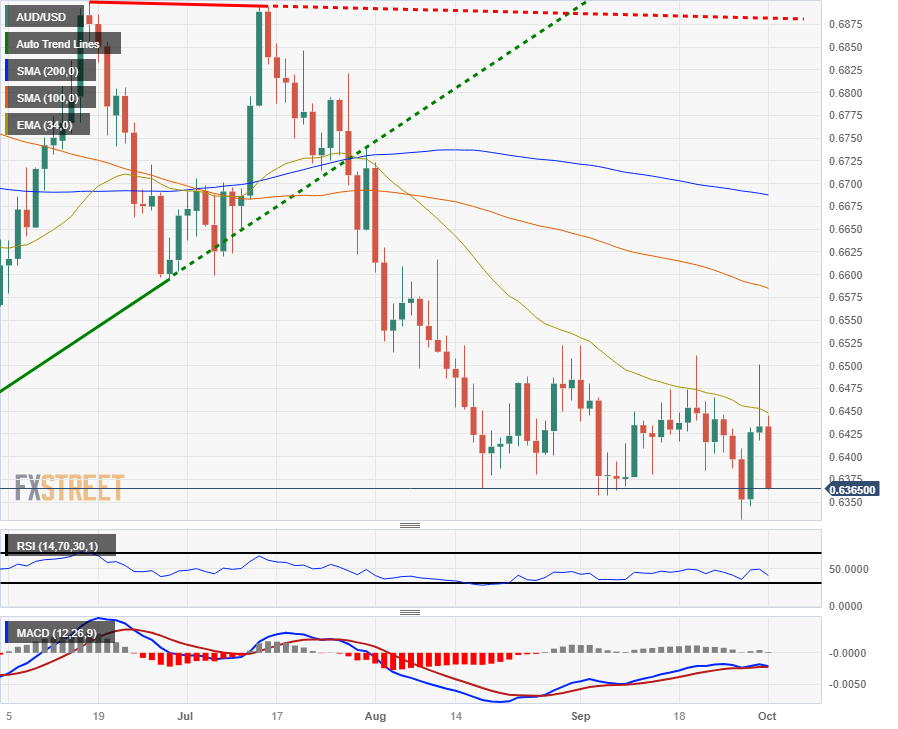
The AUD/USD has fallen back into familiar consolidation for Monday, facing a clean rejection from the 34-day Exponential Moving Average (EMA) near 0.6450.
The 0.6350 region has become familiar territory for the Aussie, a level that has chained price action since August's slide into the price region.
The AUD/USD's long-term outlook is notably bearish, and a bullish reversal will quickly run into technical resistance from the 100-day Simple Moving Average (SMA) currently settling into 0.6575.
AUD/USD daily chart
AUD/USD technical levels
Author

Joshua Gibson
FXStreet
Joshua joins the FXStreet team as an Economics and Finance double major from Vancouver Island University with twelve years' experience as an independent trader focusing on technical analysis.


