|

AUD/USD technical analysis: The Aussie erases intraday gains as the market settles near 0.6860

  • AUD/USD remains confined in a narrow range as the bulls failed to move beyond 0.6875 resistance.
  • The level to beat for bears is the 0.6850 support.
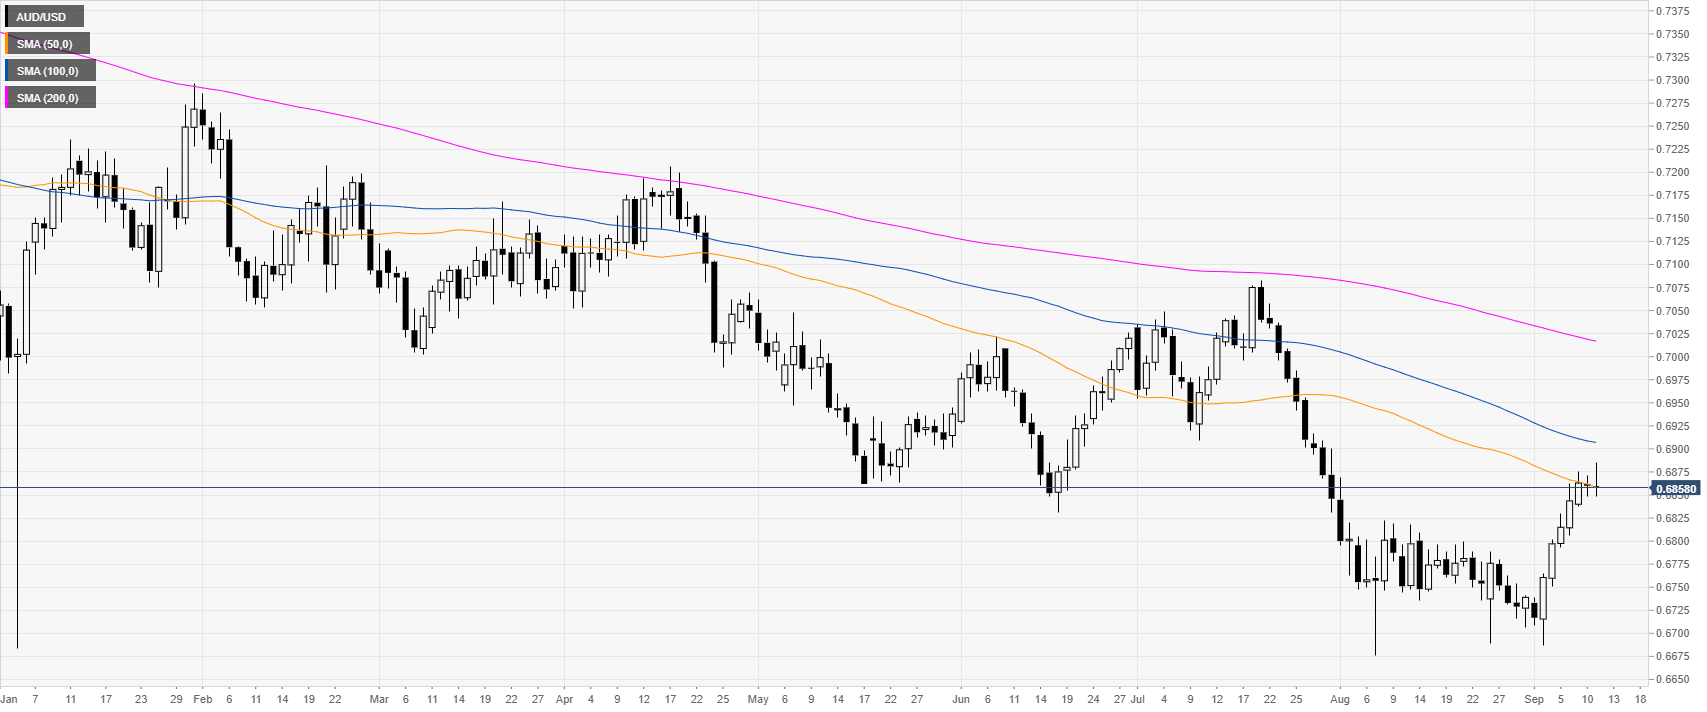
 

AUD/USD daily chart

 
The Aussie is trading in a bear trend below the 100 and 200-day simple moving averages (SMAs). However, the bulls had a sharp rebound in September as the market reached the 50 SMA at the 0.6858 level.

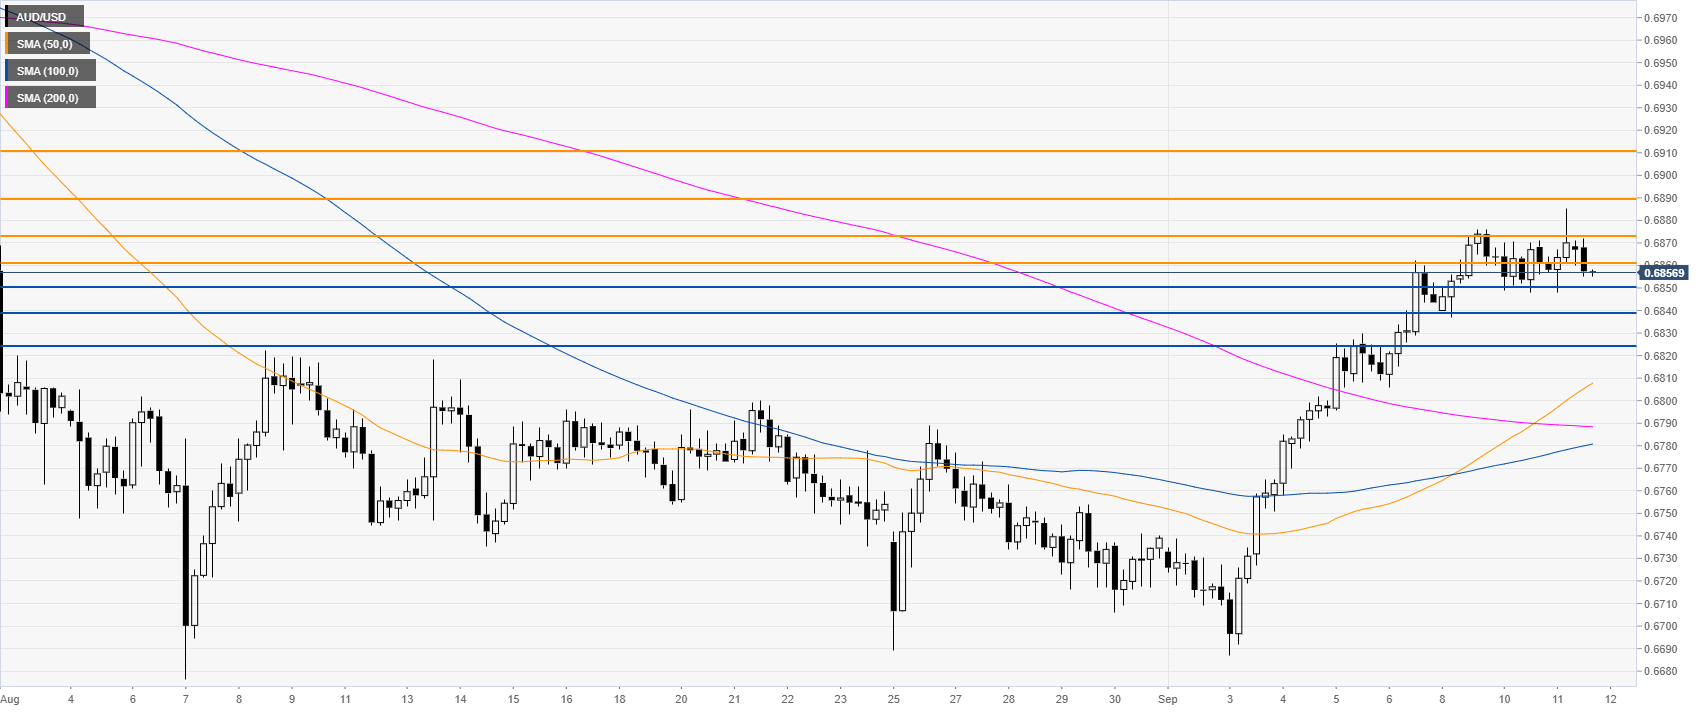
AUD/USD 4-hour chart

 
The Aussie is trading above the main simple moving averages (SMAs), suggesting bullish momentum in the near term. Buyers need a daily close above 0.6875 if they intend to extend the bull move. Further up lie 0.6890 and 0.6910 resistance levels, according to the Technical Confluences Indicator.
 

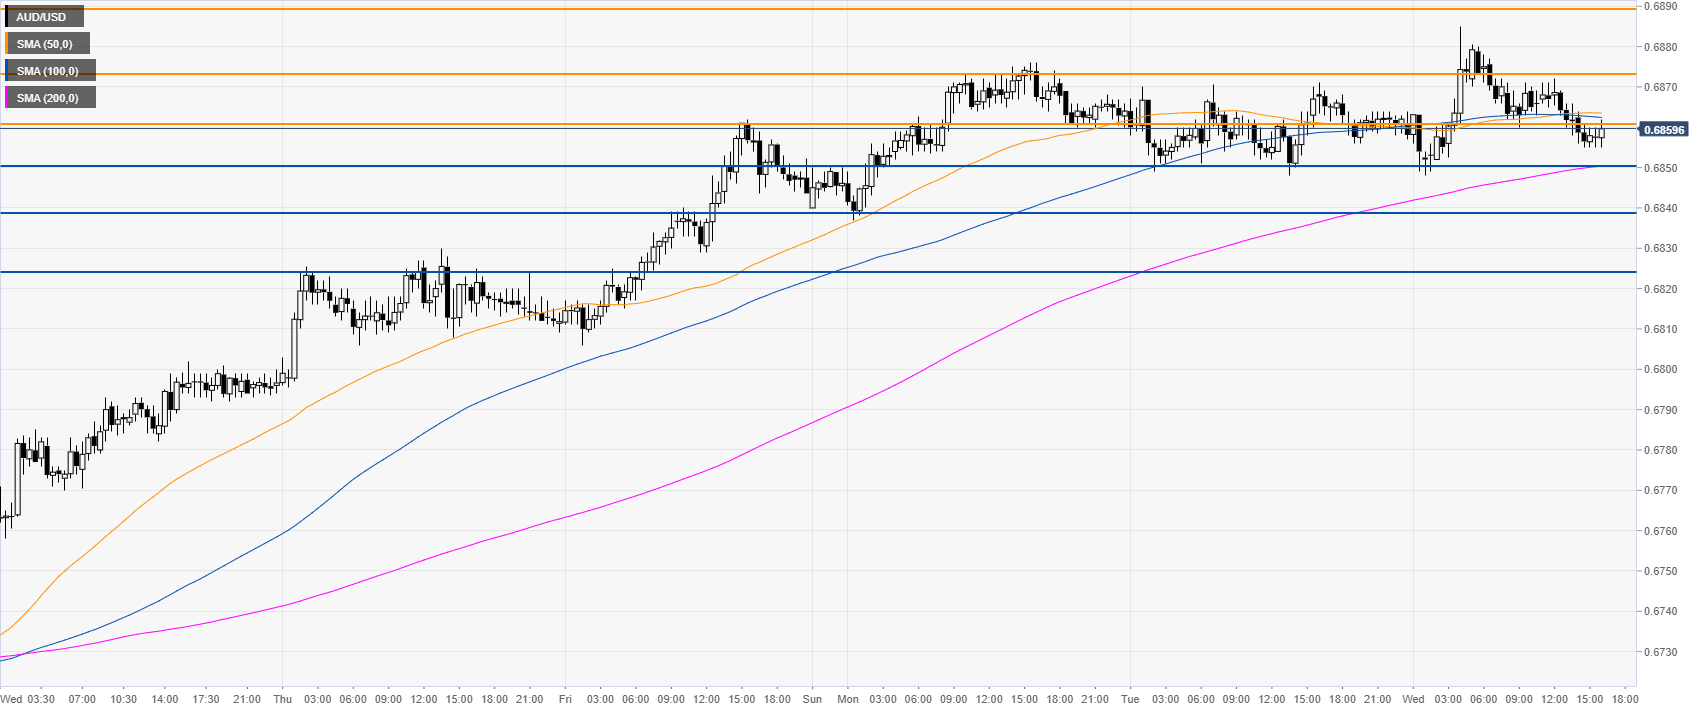
AUD/USD 30-minute chart

 
The Aussie erased its intraday gains as the market is now trading just below 0.6861 and the 50/100 SMAs. The market has been flat in the last three sessions. If bears breach 0.6850 support, it can open the door to further losses towards 0.6839 and 0.6825, according to the Technical Confluences Indicator. 


Additional key levels

AUD/USD

Overview
Today last price0.6857
Today Daily Change-0.0003
Today Daily Change %-0.04
Today daily open0.686
 
Trends
Daily SMA200.6776
Daily SMA500.6862
Daily SMA1000.6909
Daily SMA2000.7019
Levels
Previous Daily High0.6871
Previous Daily Low0.6848
Previous Weekly High0.6862
Previous Weekly Low0.6687
Previous Monthly High0.6869
Previous Monthly Low0.6676
Daily Fibonacci 38.2%0.6857
Daily Fibonacci 61.8%0.6862
Daily Pivot Point S10.6848
Daily Pivot Point S20.6837
Daily Pivot Point S30.6825
Daily Pivot Point R10.6871
Daily Pivot Point R20.6883
Daily Pivot Point R30.6894

Author

Flavio Tosti

Flavio Tosti

Independent Analyst


More from Flavio Tosti
Share:

Editor's Picks

EUR/USD slumps below 1.1750 as USD benefits from risk-aversion

EUR/USD comes under renewed bearish pressure in the European session and trades below 1.1750 following a recovery attempt earlier in the day. The US Dollar gathers strength and weighs on the pair as investors seek refuge in the wake of Israel and the United States' joint attack on Iran.

GBP/USD targets 1.3500 barrier near moving averages

GBP/USD rebounds from the daily losses, trading around 1.3450 during the Asian hours on Monday. The technical analysis of the daily chart indicates an ongoing bearish bias, as the pair trades within a descending channel pattern.

Gold surges on safe-haven demand, rises above $5,400

Gold benefits from intense risk-aversion on Monday and climbs above $5,400, setting a fresh monthly-high in the process. Tensions in the Middle East remain high as Israel and Hezbollah continue to exchange strikes following the US-Israel joint attack on Iran over the weekend.

Bitcoin, Ethereum and Ripple under pressure as key supports face breakdown risk

Bitcoin, Ethereum, and Ripple prices trade on the back foot at the start of this week on Monday, after extending losses in the previous week. BTC is on the brink of a breakdown, ETH is capped below key resistance, and XRP risks a crack of the trendline.

The market is paying for insurance, not apocalypse

As expected, this morning felt less like a Monday market open and more like a fire drill. Futures screens flickered red. S&P contracts down almost 1%. Nasdaq off 1.2%. Brent leaped 13% through $80. Gold rose 1.6% toward $5350 before paring some gains. The dollar is strutting mildly. The Swiss franc is quietly doing what it always does in a storm, catching some safe-haven flows.

Pi Network Price Forecast: Core team offloads supply, weighing on PI recovery

Pi Network  hovers below $0.1700, broadly steady at press time on Monday, attempting a recovery after a 2% loss the previous day. Sunday’s decline aligned with nearly 49 million PI tokens offloaded by the Pi Foundation, implying a spike in supply pressure that capped the prevailing four-day recovery.