|

AUD/USD Price Forecast: Odds favor continuation of short-term downtrend

  • AUD/USD has extended its downtrend to the 200-period SMA. 
  • It is biased to fall further although RSI is mildly oversold.  

AUD/USD extends the short-term downtrend it began after rolling over at the August 29 highs. 

According to technical analysis theory, “the trend is your friend” which suggests the odds favor AUD/USD further extending its downtrend to lower lows.  

AUD/USD 4-hour Chart


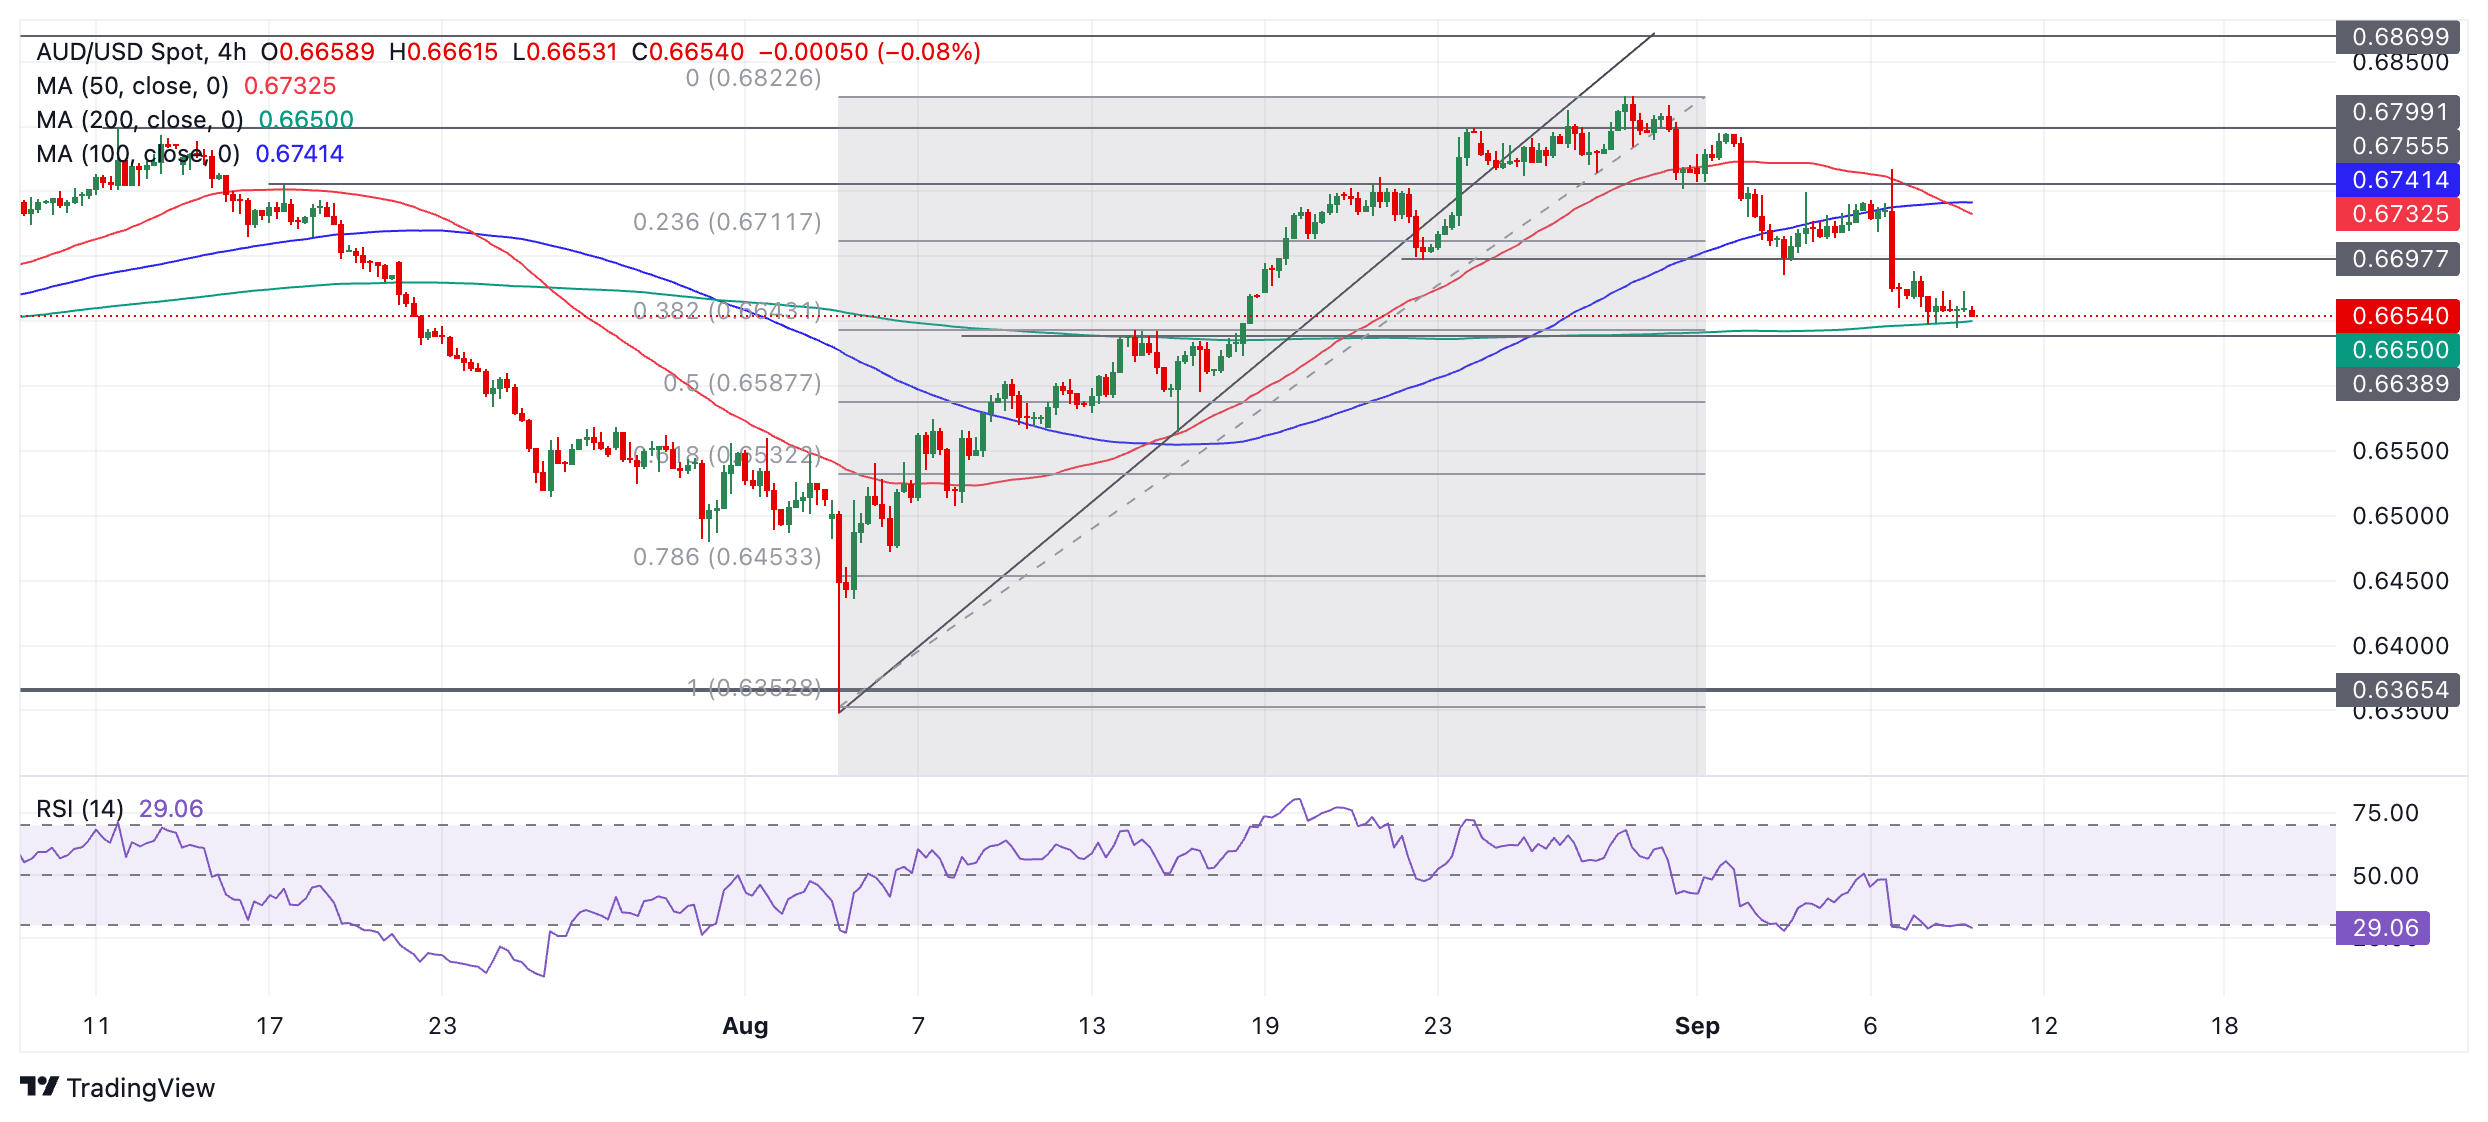
AUD/USD has met the next downside target at 0.6645 and is finding support at the 200-period Simple Moving Average (SMA). If it can close below 200 SMA and 0.6645 it will indicate the downtrend is probably falling further, with the next target at 0.6587, the 0.50 Fibonacci ratio retracement level of the August rally. 

The Relative Strength Index (RSI) momentum indicator is mildly oversold, advising traders not to add to their short positions. There is a risk of a correction, but for this to gain credence the RSI would need to recover firmly back into neutral territory. 

Further weakness could see AUD/USD fall to 0.6565 (August 15 low), followed by 0.6532, the 0.618 ration Fibonacci retracement of the August rally. At that level it will probably encounter firmer support.

Author

Joaquin Monfort

Joaquin Monfort is a financial writer and analyst with over 10 years experience writing about financial markets and alt data. He holds a degree in Anthropology from London University and a Diploma in Technical analysis.

More from Joaquin Monfort
Share:

Editor's Picks

EUR/USD seems fragile below 1.1700 as Middle East war boosts energy prices

The EUR/USD pair trades flat at around 1.1680 during the Asian trading session on Tuesday, but broadly seems vulnerable, being close to its five-week low. The major currency pair is under pressure as surging oil prices due to the United States-Israel war with Iran have increased the risks of higher inflation for the Old Continent.

GBP/USD hovers around 1.3400 with bearish pressure intact

GBP/USD edges higher after three days of losses, trading around 1.3400 during the Asian hours on Tuesday. The technical analysis of the daily chart indicates an ongoing bearish bias, as the pair trades within a descending channel pattern.

Gold stays bullish as Iran war continues to spur safe-haven flows

Gold is finding renewed bids in Asian trades on Tuesday, making another attempt to regain the $5,400 level amid persistent demand for safe-haven assets as the Iran war extends. A softer risk tone remains in play as US President Donald Trump continues to threaten deeper escalation to the ongoing war with Iran, warning that a “big wave” is yet to come.

Top Crypto Gainers: Near Protocol, Virtuals Protocol, and Morpho lead market recovery

Near Protocol, Virtuals Protocol, and Morpho are leading the market recovery with double-digit gains over the last 24 hours. Technically, NEAR extends the breakout of the falling channel pattern, VIRTUAL holds above the 50-day EMA, while MORPHO tests a crucial resistance. 

The market is not panicking it is repricing the probability distribution of Oil and time

At the end of the day, markets do not trade morality or geopolitics. They trade transmission channels. And the only channel that truly matters in this maelstrom runs through the price of energy and the time value of money.

Grass 20% bullish breakout defies broader market weakness

Grass (GRASS) is edging up above $0.30 at the time of writing on Monday. The token’s notable 20% intraday surge stands out amid heightened volatility in the broader crypto market.