AUD/USD Price Forecast: Holds position around 0.6500, next barrier appears at nine-day EMA
- AUD/USD finds resistance at the psychological level of 0.6500 amid ongoing bearish bias.
- The pair may test support around the psychological level of 0.6400, followed by the descending channel’s lower boundary.
- Further resistance appears around the nine-day EMA at 0.6518.

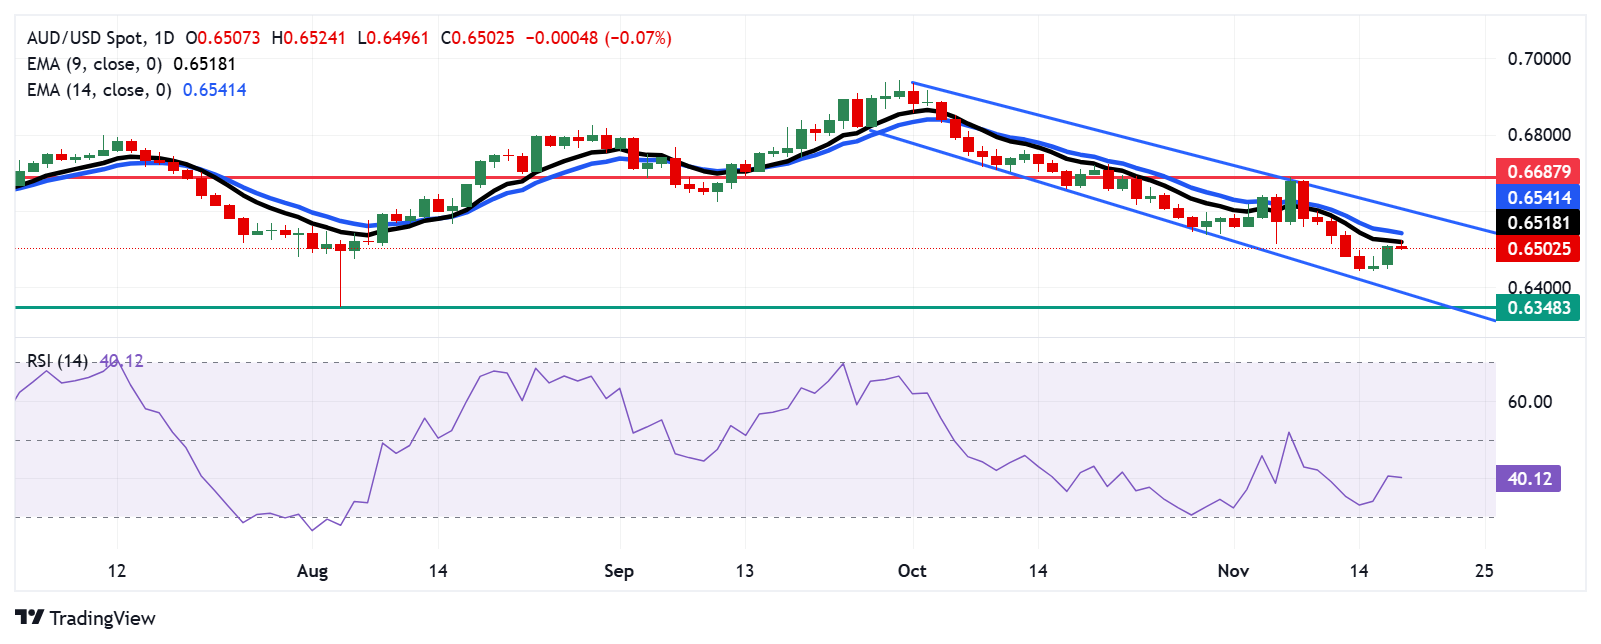
AUD/USD halts two days of gains, trading around 0.6500 during the European hours on Tuesday. Technical analysis of the daily chart shows the pair moving downwards within a descending channel pattern, reinforcing an ongoing bearish bias.
The 14-day Relative Strength Index (RSI) is positioned below the 50 level, confirming the prevailing bearish sentiment. Additionally, the nine-day EMA remains below the 14-day EMA, which suggests a bearish price momentum for a short-term period.
In terms of support, the AUD/USD pair may approach the psychological level of 0.6400, followed by the lower boundary of the descending channel at 0.6390 level. A decisive break below the descending channel could amplify selling pressure, potentially driving the pair toward its yearly low of 0.6348, last recorded on August 5.
On the upside, the 0.6500 level serves as immediate resistance. A sustained move above this threshold might push the AUD/USD pair toward the nine-day EMA at 0.6518, followed by the 14-day EMA at 0.6541 level. Surpassing these levels could pave the way for a rally toward the three-week high of 0.6687.
AUD/USD: Daily Chart
Australian Dollar PRICE Today
The table below shows the percentage change of Australian Dollar (AUD) against listed major currencies today. Australian Dollar was the weakest against the Japanese Yen.
| USD | EUR | GBP | JPY | CAD | AUD | NZD | CHF | |
|---|---|---|---|---|---|---|---|---|
| USD | 0.19% | 0.14% | -0.35% | 0.06% | 0.06% | 0.12% | 0.07% | |
| EUR | -0.19% | -0.03% | -0.54% | -0.12% | -0.12% | -0.06% | -0.12% | |
| GBP | -0.14% | 0.03% | -0.49% | -0.09% | -0.09% | -0.03% | -0.07% | |
| JPY | 0.35% | 0.54% | 0.49% | 0.43% | 0.42% | 0.47% | 0.44% | |
| CAD | -0.06% | 0.12% | 0.09% | -0.43% | 0.00% | 0.06% | 0.01% | |
| AUD | -0.06% | 0.12% | 0.09% | -0.42% | -0.00% | 0.06% | 0.01% | |
| NZD | -0.12% | 0.06% | 0.03% | -0.47% | -0.06% | -0.06% | -0.04% | |
| CHF | -0.07% | 0.12% | 0.07% | -0.44% | -0.01% | -0.01% | 0.04% |
The heat map shows percentage changes of major currencies against each other. The base currency is picked from the left column, while the quote currency is picked from the top row. For example, if you pick the Australian Dollar from the left column and move along the horizontal line to the US Dollar, the percentage change displayed in the box will represent AUD (base)/USD (quote).
Author

Akhtar Faruqui
FXStreet
Akhtar Faruqui is a Forex Analyst based in New Delhi, India. With a keen eye for market trends and a passion for dissecting complex financial dynamics, he is dedicated to delivering accurate and insightful Forex news and analysis.


