- AUD/USD finished the week with substantial losses of 2.61%.
- On Friday, the AUD/USD seesawed on a 200-pip range, notably reaching a weekly close below 0.6200.
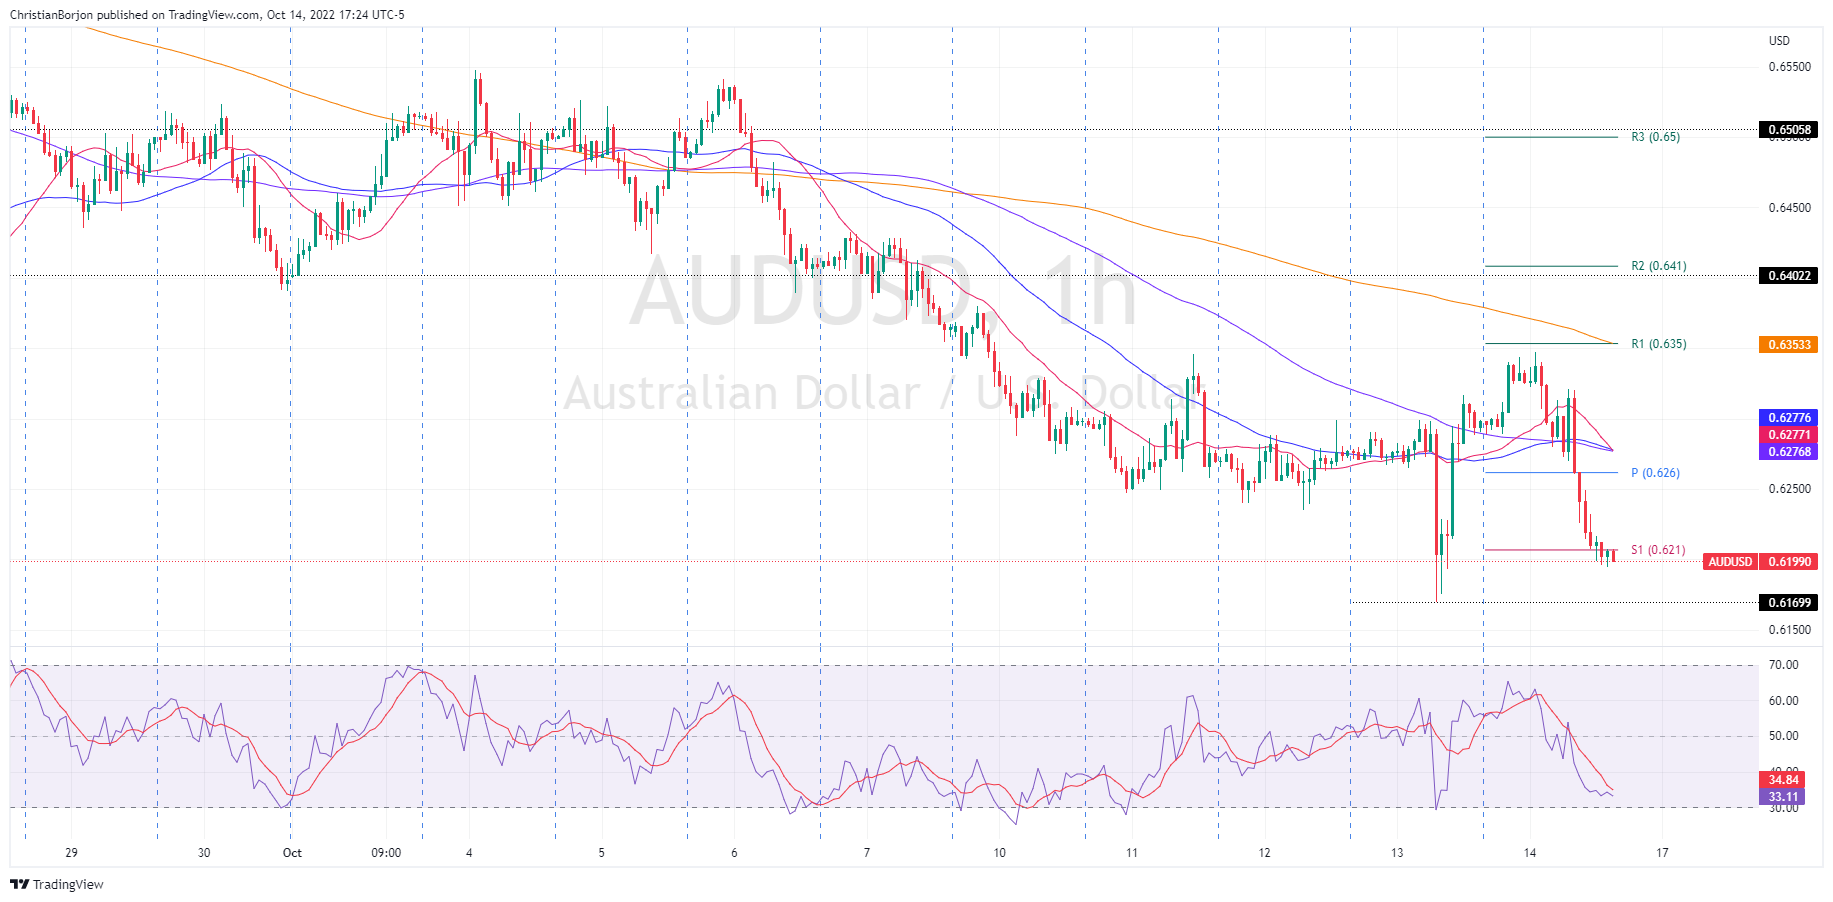
- AUD/USD Price Forecast: To tumble to 0.6100 if sellers clear the YTD low; otherwise, a move towards 0.6300 is on the cards.
On Friday, the Australian dollar finished the week on the wrong foot, tumbling below 0.6200 amidst a dampened market mood, with investors dumping everything risk-perceived in the FX space, the Aussie dollar. Therefore, the AUD/USD accelerated its downfall, trading at 0.6199, below Friday’s opening price by 1.58%.
AUD/USD Price Forecast
The AUD/USD daily chart depicts the pair seesawed in a 220-pip range after hitting a daily high of 0.6347 before tumbling under the 0.6200 figure. Worth noting that on its way down, the AUD/USD Friday close was 0.6199, exposing crucial support levels, like the YTD low of 0.6169, which, if cleared, could open the door towards 0.6100.
Oscillators are at oversold conditions, though registering higher lows, while price action is registering lower lows. That said, a positive divergence might be forming.
In the short term, the AUD/USD is neutral biased, though oscillators in negative territory and price action could open the door for further downside action. Therefore, the AUD/USD first support would be the YTD low of 0.6169, followed by the 0.6100 figure. The break below will expose the figure at 0.6000.
Contrarily, if the AUD/JPY bounces from below 0.6200, it would expose essential resistance levels, like 0.6250, followed by the confluence of the 100, 20 and 50-EMAs, around 0.6276/77, followed by the 0.6300 mark.
AUD/USD Key Technical Levels
Information on these pages contains forward-looking statements that involve risks and uncertainties. Markets and instruments profiled on this page are for informational purposes only and should not in any way come across as a recommendation to buy or sell in these assets. You should do your own thorough research before making any investment decisions. FXStreet does not in any way guarantee that this information is free from mistakes, errors, or material misstatements. It also does not guarantee that this information is of a timely nature. Investing in Open Markets involves a great deal of risk, including the loss of all or a portion of your investment, as well as emotional distress. All risks, losses and costs associated with investing, including total loss of principal, are your responsibility. The views and opinions expressed in this article are those of the authors and do not necessarily reflect the official policy or position of FXStreet nor its advertisers. The author will not be held responsible for information that is found at the end of links posted on this page.
If not otherwise explicitly mentioned in the body of the article, at the time of writing, the author has no position in any stock mentioned in this article and no business relationship with any company mentioned. The author has not received compensation for writing this article, other than from FXStreet.
FXStreet and the author do not provide personalized recommendations. The author makes no representations as to the accuracy, completeness, or suitability of this information. FXStreet and the author will not be liable for any errors, omissions or any losses, injuries or damages arising from this information and its display or use. Errors and omissions excepted.
The author and FXStreet are not registered investment advisors and nothing in this article is intended to be investment advice.
Recommended content
Editors’ Picks

EUR/USD trades sideways below 1.0450 amid quiet markets
EUR/USD defends gains below 1.0450 in European trading on Monday. Thin trading heading into the Xmas holiday and a modest US Dollar rebound leaves the pair in a familair range. Meanwhile, ECB President Lagarde's comments fail to impress the Euro.

GBP/USD stays defensive below 1.2600 after UK Q3 GDP revision
GBP/USD trades on the defensive below 1.2600 in the European session on Monday. The pair holds lower ground following the downward revision to the third-quarter UK GDP data, which weighs negatively on the Pound Sterling amid a broad US Dollar uptick.

Gold price sticks to modest gains; upside seems limited amid USD dip-buying
Gold price attracts some follow-through buying at the start of a new week and looks to build on its recovery from a one-month low touched last Thursday. Geopolitical risks stemming from the protracted Russia-Ukraine war and tensions in the Middle East, along with trade war fears, turn out to be key factors benefiting the safe-haven precious metal.

The US Dollar ends the year on a strong note
The US Dollar ends the year on a strong note, hitting two-year highs at 108.45. The Fed expects a 50-point rate cut for the full year 2025 versus 4 cuts one quarter earlier, citing higher inflation forecasts and a stubbornly strong labour market.
Bank of England stays on hold, but a dovish front is building
Bank of England rates were maintained at 4.75% today, in line with expectations. However, the 6-3 vote split sent a moderately dovish signal to markets, prompting some dovish repricing and a weaker pound. We remain more dovish than market pricing for 2025.

Best Forex Brokers with Low Spreads
VERIFIED Low spreads are crucial for reducing trading costs. Explore top Forex brokers offering competitive spreads and high leverage. Compare options for EUR/USD, GBP/USD, USD/JPY, and Gold.