AUD/USD Price Analysis: Up leg within sideways trend approaches ceiling


  • AUD/USD is unfolding an up leg within a range which is approaching the range highs. 
  • If it reaches the highs the pair could reverse and begin a move south, extending the sideways trend. 
  • A clear breakout above the range highs or lows would be required to give the pair directionality again.

AUD/USD trades about a half of a percent higher in the 0.6660s on Friday as the pair continues rising following a bounce from the May 24 swing lows. 

The pair has probably entered a sideways trend and since “the trend is your friend” this range-bound market mode is likely to extend. The range the Aussie finds itself trading in appears to have a high at the May 26 high of 0.6680 and a floor at 0.6591 (May 30 low). 

AUD/USD 4-hour Chart

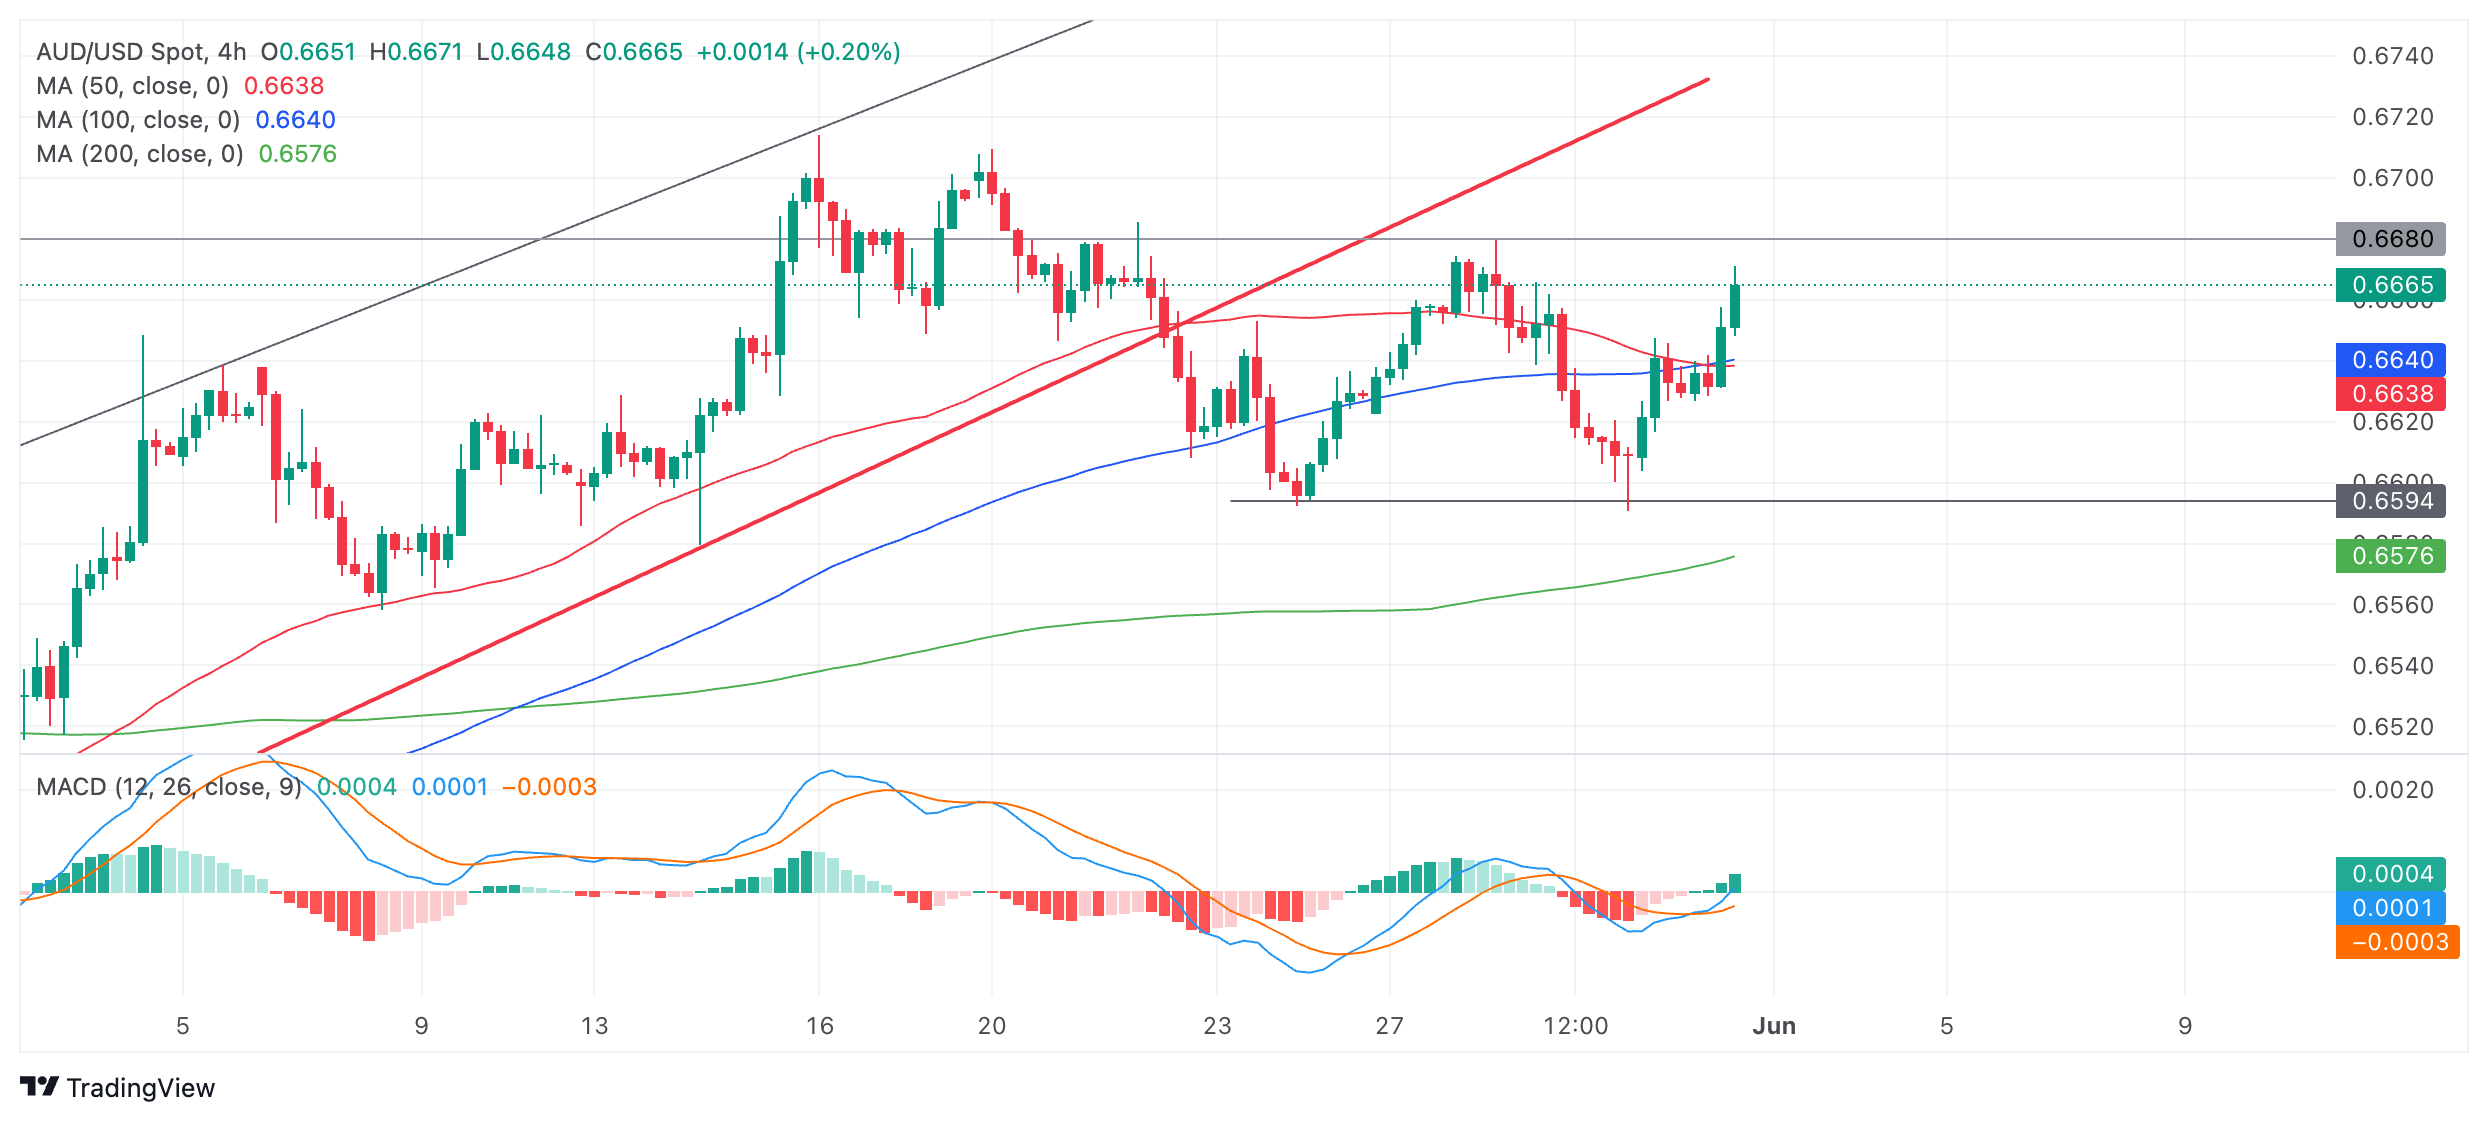
The current leg up within the range could reach the range ceiling at 0.6680 before reversing and starting a down leg to the range floor. 

The Moving Average Convergence Divergence (MACD) momentum indicator has crossed above its red signal line, giving a buy signal and supporting the move higher. 

If AUD/USD reaches the range highs or close to them and then rolls over and forms a Japanese candlestick reversal pattern it could be a sign the pair is extending its sideways trend and a leg down is about to begin. 

A MACD cross back below the signal line – especially if in positive territory – would add further evidence to suggest a move down within the narrow range was evolving. 

Failed breakdown

AUD/USD broke down from its rising channel on May 22, bringing the established uptrend into doubt. Follow-through lower was weak, however, and the pair soon found its feet. There is no clear short-term directional trend suggesting the trend may actually be sideways. 

It would require a decisive break below 0.6591 to confirm more downside, with the next target probably at 0.6560 where the 100 and 50-day SMAs are located (not shown). 

Alternatively, a decisive break above the range ceiling would reassert the bullish bias and probably lead to 0.6714 (May 14 high). 

Decisive breaks are accompanied by long candles that break through the level and close near their high or low or three consecutive candles that pierce the level in question and are all of the same color (red for a bearish decisive break and green for bullish). 


Share: Feed news

Information on these pages contains forward-looking statements that involve risks and uncertainties. Markets and instruments profiled on this page are for informational purposes only and should not in any way come across as a recommendation to buy or sell in these assets. You should do your own thorough research before making any investment decisions. FXStreet does not in any way guarantee that this information is free from mistakes, errors, or material misstatements. It also does not guarantee that this information is of a timely nature. Investing in Open Markets involves a great deal of risk, including the loss of all or a portion of your investment, as well as emotional distress. All risks, losses and costs associated with investing, including total loss of principal, are your responsibility. The views and opinions expressed in this article are those of the authors and do not necessarily reflect the official policy or position of FXStreet nor its advertisers. The author will not be held responsible for information that is found at the end of links posted on this page.

If not otherwise explicitly mentioned in the body of the article, at the time of writing, the author has no position in any stock mentioned in this article and no business relationship with any company mentioned. The author has not received compensation for writing this article, other than from FXStreet.

FXStreet and the author do not provide personalized recommendations. The author makes no representations as to the accuracy, completeness, or suitability of this information. FXStreet and the author will not be liable for any errors, omissions or any losses, injuries or damages arising from this information and its display or use. Errors and omissions excepted.

The author and FXStreet are not registered investment advisors and nothing in this article is intended to be investment advice.

Recommended content


Recommended content

Editors’ Picks

EUR/USD retreats to 1.0700 area following post-PCE jump

EUR/USD retreats to 1.0700 area following post-PCE jump

After spiking to a daily high of 1.0720 with the immediate reaction to US PCE inflation data, EUR/USD lost its traction and declined to the 1.0700 area. Investors remain cautious ahead of this weekend's French election and make it difficult for the Euro to gather strength.

EUR/USD News

GBP/USD stays below 1.2650 after US inflation data

GBP/USD stays below 1.2650 after US inflation data

GBP/USD struggles to preserve its bullish momentum and trades below 1.2650 in the American session on Friday. Earlier in the day, the data from the US showed that the annual core PCE inflation declined to 2.6% in May, limiting the USD's upside and helping the pair hold its ground.

GBP/USD News

Gold keeps its daily gains near $2,330 following US PCE data

Gold keeps its daily gains near $2,330 following US PCE data

Gold prices maintain their constructive bias around $2,330 after US inflation readings gauged by the PCE matched consensus in May and US yields advance slightly across the curve.

Gold News

BTC struggles around the $62,000 level

BTC struggles around the $62,000 level

Bitcoin price faces pullback resistance at the lower band of the descending wedge around $62,000. Ethereum price finds support at $3,288, the 61.8% Fibonacci retracement level. Ripple price faces resistance at $0.500, its daily resistance level.

Read more

French Elections Preview: Euro to suffer after the calm, as specter of extremists, uncertainty rise Premium

French Elections Preview: Euro to suffer after the calm, as specter of extremists, uncertainty rise

The first round of French parliamentary elections is set to trigger high uncertainty. Soothing messages from the far right and far left leave the Euro vulnerable to falls. Calm may return only after the second round of voting on  July 7.

Read more

Forex MAJORS

Cryptocurrencies

Signatures