AUD/USD Price Analysis: Steadies around 0.7100 amid hidden bearish RSI divergence


  • AUD/USD seesaws around five-month high as bulls take a breather after four-day uptrend.
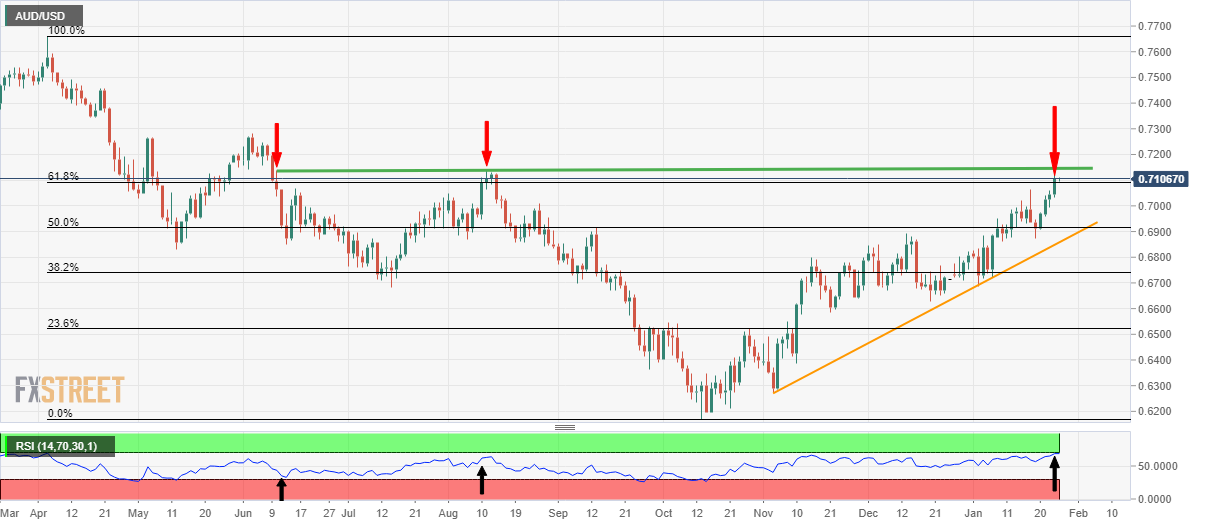
  • Higher highs on RSI (14) contrast with the lower high on prices to probe the bullish trend.
  • Overbought RSI conditions, seven-month-old horizontal hurdle also challenge buyers.
  • 61.8% Fibonacci retracement, previous weekly high restrict immediate downside.

AUD/USD pauses the four-day uptrend around the highest level since August 2022 as it makes rounds to 0.7100 during Thursday’s sluggish Asian session. Even so, the Aussie pair braces for the biggest weekly gains since early November.

The quote rose to the multi-month high on crossing the 61.8% Fibonacci retracement level of its April-October 2022 downside. However, the overbought RSI (14) seems to probe the buyers afterward.

Also challenging the upside bias is the hidden bearish RSI divergence, a condition where the price prints lower highs but the indicator prints higher highs.

As a result, the AUD/USD bulls should wait for a confirmation of the latest bullish trend. In doing so, the horizontal area comprising multiple highs marked since June 2022, near 0.7140 will be the key to watch.

Following that, a run-up towards the June 2022 high near 0.7285 can be expected. It’s worth noting that the 0.7200 round figure may act as an intermediate halt during the likely run-up.

Alternatively, pullback moves need to conquer the 61.8% Fibonacci retracement level, also known as the ‘golden ratio’, around 0.7090, to tease the AUD/USD bears.

Even so, the previous weekly high near 0.7065, could act as the additional downside filter before convincing the sellers to attack the 0.7000 psychological magnet.

AUD/USD: Daily chart

Trend: Pullback expected

Additional important levels

Overview
Today last price 0.7105
Today Daily Change 0.0063
Today Daily Change % 0.89%
Today daily open 0.7042
 
Trends
Daily SMA20 0.689
Daily SMA50 0.6792
Daily SMA100 0.6646
Daily SMA200 0.6816
 
Levels
Previous Daily High 0.7058
Previous Daily Low 0.6993
Previous Weekly High 0.7064
Previous Weekly Low 0.6872
Previous Monthly High 0.6893
Previous Monthly Low 0.6629
Daily Fibonacci 38.2% 0.7033
Daily Fibonacci 61.8% 0.7018
Daily Pivot Point S1 0.7005
Daily Pivot Point S2 0.6967
Daily Pivot Point S3 0.694
Daily Pivot Point R1 0.7069
Daily Pivot Point R2 0.7096
Daily Pivot Point R3 0.7134


Share: Feed news

Information on these pages contains forward-looking statements that involve risks and uncertainties. Markets and instruments profiled on this page are for informational purposes only and should not in any way come across as a recommendation to buy or sell in these assets. You should do your own thorough research before making any investment decisions. FXStreet does not in any way guarantee that this information is free from mistakes, errors, or material misstatements. It also does not guarantee that this information is of a timely nature. Investing in Open Markets involves a great deal of risk, including the loss of all or a portion of your investment, as well as emotional distress. All risks, losses and costs associated with investing, including total loss of principal, are your responsibility. The views and opinions expressed in this article are those of the authors and do not necessarily reflect the official policy or position of FXStreet nor its advertisers. The author will not be held responsible for information that is found at the end of links posted on this page.

If not otherwise explicitly mentioned in the body of the article, at the time of writing, the author has no position in any stock mentioned in this article and no business relationship with any company mentioned. The author has not received compensation for writing this article, other than from FXStreet.

FXStreet and the author do not provide personalized recommendations. The author makes no representations as to the accuracy, completeness, or suitability of this information. FXStreet and the author will not be liable for any errors, omissions or any losses, injuries or damages arising from this information and its display or use. Errors and omissions excepted.

The author and FXStreet are not registered investment advisors and nothing in this article is intended to be investment advice.

Recommended content


Recommended content

Editors’ Picks

EUR/USD stays below 1.1100, looks to post weekly losses

EUR/USD stays below 1.1100, looks to post weekly losses

EUR/USD continues to trade in a narrow range below 1.1100 and remains on track to end the week in negative territory. Earlier in the day, monthly PCE inflation data from the US came in line with the market expectation, failing to trigger a reaction.

EUR/USD News
GBP/USD struggles to find a foothold, trades near 1.3150

GBP/USD struggles to find a foothold, trades near 1.3150

GBP/USD stays on the back foot and trades in negative territory at around 1.3150 on Friday. The US Dollar holds its ground following the July PCE inflation data and doesn't allow the pair to stage a rebound heading into the weekend.

GBP/USD News
Gold retreats toward $2,500 ahead of the weekend

Gold retreats toward $2,500 ahead of the weekend

Gold stays under modest bearish pressure and declines toward $2,500 in the American session on Friday. The 10-year US Treasury bond yield edges higher toward 3.9% after US PCE inflation data, causing XAU/USD to stretch lower.

Gold News
Week ahead – Investors brace for NFP amid Fed rate cut speculation

Week ahead – Investors brace for NFP amid Fed rate cut speculation

Here comes another NFP week, with investors eagerly awaiting the results as they try to discern the size and pace of the Fed’s forthcoming rate cuts. The weaker than expected July numbers triggered market turbulence, instilling fears about a potential recession in the US.

Read more
Easing Eurozone inflation to back an ECB rate cut in September

Easing Eurozone inflation to back an ECB rate cut in September Premium

Eurostat will publish the preliminary estimate of the August Eurozone Harmonized Index of Consumer Prices on Friday, and the anticipated outcome will back up the case for another European Central Bank interest rate cut when policymakers meet in September.

Read more
Moneta Markets review 2024: All you need to know

Moneta Markets review 2024: All you need to know

VERIFIED In this review, the FXStreet team provides an independent and thorough analysis based on direct testing and real experiences with Moneta Markets – an excellent broker for novice to intermediate forex traders who want to broaden their knowledge base.

Read More

Forex MAJORS

Cryptocurrencies

Signatures