AUD/USD Price Analysis: Stays directed to 0.7820 immediate hurdle
- AUD/USD reverses early Asian losses, off intraday low.
- Westpac Consumer Confidence dropped to -4.8% in May versus +6.2% prior.
- Monthly horizontal line tame bulls inside five-week-old rising channel.
- 50-day SMA adds to the downside filters, sluggish Momentum probe bulls near key resistance.

AUD/USD picks up bids from intraday low to 0.7791, taming short-term bears of late, during early Tuesday. The pair recently paid a little heed to downbeat Westpac Consumer Confidence as the risk-tone improves. However, buyers remain cautious ahead of Australia’s Q1 Wage Price Index, forecast 0.5% QoQ versus 0.6% previous readouts.
Technically, the pair portrays a short-term rising channel formation above 50-day SMA, supporting AUD/USD bulls.
However, the sluggish Momentum indicator restricts the pair’s immediate upside around the one-month-old horizontal resistance area of 0.7815-20.
Hence, the AUD/USD buyers remain hopeful but need a clear break of 0.7820 to challenge the monthly high near 0.7890, not to forget the stated channel’s upper line close to 0.7930.
On the flip side, the channel’s support line and 50-day SMA, respectively around 0.7735 and 0.7715, can restrict the quote’s short-term declines.
Also acting as additional support is a horizontal line comprising early April tops and the current month low around 0.7675.
Overall, AUD/USD remains in the upward trajectory but buyers need fresh fuel.
AUD/USD daily chart
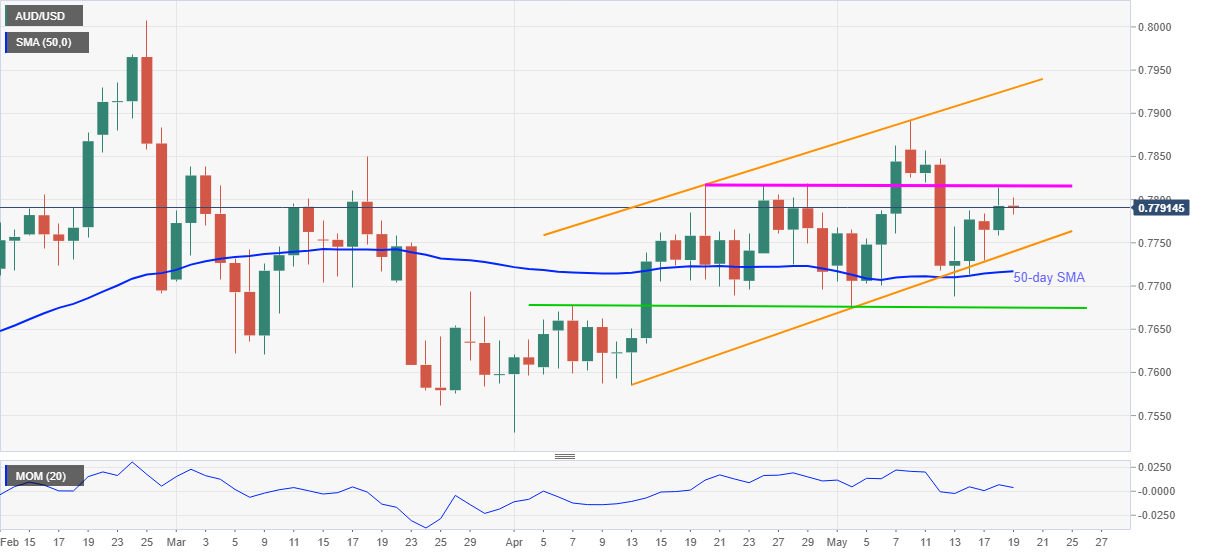
Trend: Bullish
Author

Anil Panchal
FXStreet
Anil Panchal has nearly 15 years of experience in tracking financial markets. With a keen interest in macroeconomics, Anil aptly tracks global news/updates and stays well-informed about the global financial moves and their implications.


