- AUD/USD is facing hurdles after a less-confident pullback move ahead of US GDP.
- Consistently declining Australian CPI indicates that the RBA will keep interest rates steady further.
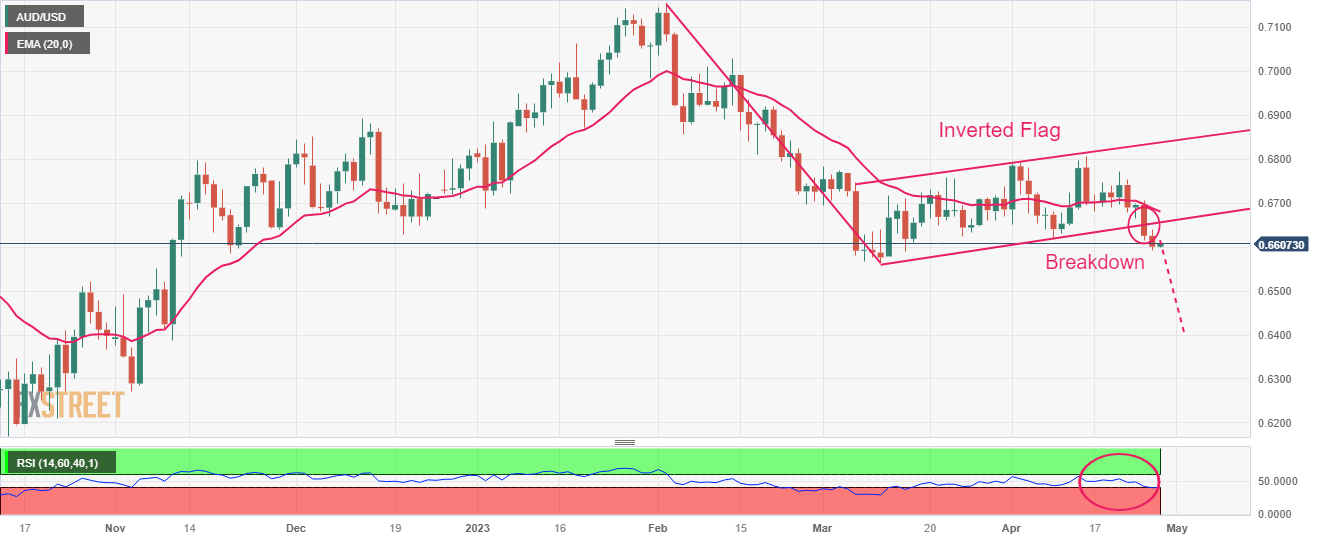
- AUD/USD is in a bearish trajectory after a breakdown of the Inverted Flag chart pattern.
The AUD/USD pair has sensed selling pressure after a less-confident pullback to near 0.6611 in the Tokyo session. The Aussie asset has resumed its downside journey as the USD Dollar Index (DXY) is concluding its marginal corrective move.
Investors are expected to shift their funds into the US Dollar amid anxiety ahead of the United States Gross Domestic Product (GDP) (Q1) data. A decline is expected to 2.0% from the former print of 2.6%. The street is anticipating a decline in GDP numbers as firms have postponed their expansion plans to avoid higher interest obligations.
The Australian Dollar witnessed an extreme sell-off on Wednesday after the soft landing of inflation data. The consistently declining Australian Consumer Price Index (CPI) indicates that the Reserve Bank of Australia (RBA) will keep interest rates steady further.
AUD/USD is in a bearish trajectory after a breakdown of the Inverted Flag chart pattern formed on the daily scale. The aforementioned chart pattern is a trend continuation pattern in which a long consolidation is followed by a breakdown.
The 20-period Exponential Moving Average (EMA) around 0.6680 is acting as a barricade for the Aussie bulls.
The Relative Strength Index (RSI) (14) has slipped into the bearish range of 20.00-40.00, which indicates an activation of downside momentum.
US Dollar bulls will flex their muscles if the Aussie asset will drop below March 15 low at 0.6590. An occurrence of the same will expose the asset to March 08 low at 0.6568 followed by 02 November 2022 high around 0.6500.
In an alternate scenario, only a decisive move above the round-level resistance of 0.6800 will drive the asset toward February 23 high at 0.6872 and February 20 high at 0.6920.
AUD/USD daily chart
Information on these pages contains forward-looking statements that involve risks and uncertainties. Markets and instruments profiled on this page are for informational purposes only and should not in any way come across as a recommendation to buy or sell in these assets. You should do your own thorough research before making any investment decisions. FXStreet does not in any way guarantee that this information is free from mistakes, errors, or material misstatements. It also does not guarantee that this information is of a timely nature. Investing in Open Markets involves a great deal of risk, including the loss of all or a portion of your investment, as well as emotional distress. All risks, losses and costs associated with investing, including total loss of principal, are your responsibility. The views and opinions expressed in this article are those of the authors and do not necessarily reflect the official policy or position of FXStreet nor its advertisers. The author will not be held responsible for information that is found at the end of links posted on this page.
If not otherwise explicitly mentioned in the body of the article, at the time of writing, the author has no position in any stock mentioned in this article and no business relationship with any company mentioned. The author has not received compensation for writing this article, other than from FXStreet.
FXStreet and the author do not provide personalized recommendations. The author makes no representations as to the accuracy, completeness, or suitability of this information. FXStreet and the author will not be liable for any errors, omissions or any losses, injuries or damages arising from this information and its display or use. Errors and omissions excepted.
The author and FXStreet are not registered investment advisors and nothing in this article is intended to be investment advice.


Recommended content
Editors’ Picks

EUR/USD bounces off lows, retests 1.1370
Following an early drop to the vicinity of 1.1310, EUR/USD now manages to regain pace and retargets the 1.1370-1.1380 band on the back of a tepid knee-jerk in the US Dollar, always amid growing optimism over a potential de-escalation in the US-China trade war.

GBP/USD consolidates losses near 1.3300 after UK Retail Sales data
GBP/USD remains under moderate selling pressure near 1.3300 despite the upbeat UK Retail Sales data for March. The pair feels the heat of the solid US Dollar rebound, aided by latest headlines hinting at a softening rhetoric in the ongoing US-China trade conflict.

Gold drops toward $3,250 as market mood improves
Gold turns south following Thursday's rebound and declines toward $3,250 on Friday. The bearish pressure builds up as market mood improves on growing optimism about a de-escalation of the US-China trade conflict after US President Trump hinted at the beginning of negotiations.

Ethereum: Accumulation addresses grab 1.11 million ETH as bullish momentum rises
Ethereum saw a 1% decline on Friday as sellers dominated exchange activity in the past 24 hours. Despite the recent selling, increased inflows into accumulation addresses and declining net taker volume show a gradual return of bullish momentum.

Week ahead: US GDP, inflation and jobs in focus amid tariff mess – BoJ meets
Barrage of US data to shed light on US economy as tariff war heats up. GDP, PCE inflation and nonfarm payrolls reports to headline the week. Bank of Japan to hold rates but may downgrade growth outlook. Eurozone and Australian CPI also on the agenda, Canadians go to the polls.

The Best brokers to trade EUR/USD
SPONSORED Discover the top brokers for trading EUR/USD in 2025. Our list features brokers with competitive spreads, fast execution, and powerful platforms. Whether you're a beginner or an expert, find the right partner to navigate the dynamic Forex market.