|

AUD/USD Price Analysis: Retreats from weekly hurdle near 0.6810 but downside appears limited

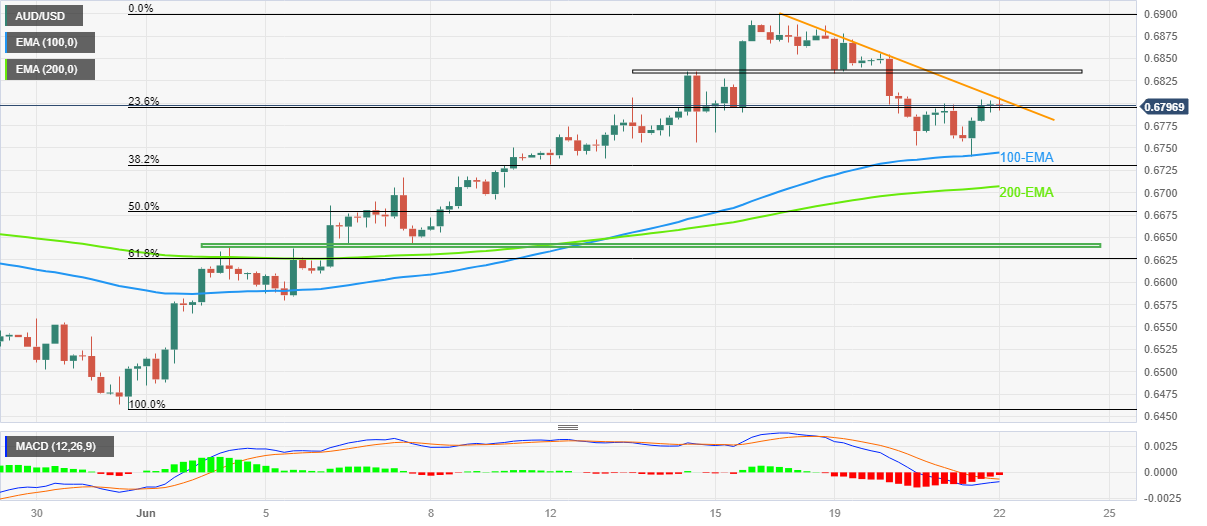
  • AUD/USD fades the previous day’s rebound from weekly low as descending trend line from Friday prod bulls.
  • Key EMAs, monthly horizontal support stand tall to challenge Aussie bears.
  • Easing bearish bias of MACD signals also checks sellers.
  • Buyers can aim for fresh monthly high on clear break of 0.6810.

AUD/USD fails to extend the previous day’s corrective bounce off a one-week low, as well as the 100-Exponential Moving Average (EMA), amid early Thursday in Europe. In doing so, the risk-barometer pair portrays the market’s cautious mood ahead of multiple central bank announcements while also suffering from China’s holiday.

AUD/USD pair’s latest retreat could be linked to its inability to cross the weekly resistance line, around 0.6810 by the press time.

However, the quote’s sustained trading beyond the 100-EMA and 200-EMA, as well as an impending bull cross on the MACD indicator, challenge the Aussie pair sellers.

Apart from the 100-EMA and 200-EMA, respectively near 0.6745 and 0.6700, a horizontal area comprising multiple levels marked since June 02, close to 0.6640, also appears to challenge the AUD/USD bears before giving them control.

Alternatively, a successful break of the aforementioned resistance line from Friday, close to 0.6810 at the latest, can trigger the AUD/USD pair’s run-up towards refreshing the monthly top, currently around 0.6900.

It should be noted that a one-week-long horizontal region around 0.6840 acts as an extra filter towards the north.

AUD/USD: Four-hour chart

Trend: Limited downside expected

Additional important levels

Overview
Today last price0.6797
Today Daily Change0.0000
Today Daily Change %0.00%
Today daily open0.6797
 
Trends
Daily SMA200.6683
Daily SMA500.6681
Daily SMA1000.672
Daily SMA2000.6692
 
Levels
Previous Daily High0.6804
Previous Daily Low0.6741
Previous Weekly High0.69
Previous Weekly Low0.6732
Previous Monthly High0.6818
Previous Monthly Low0.6458
Daily Fibonacci 38.2%0.678
Daily Fibonacci 61.8%0.6765
Daily Pivot Point S10.6757
Daily Pivot Point S20.6717
Daily Pivot Point S30.6693
Daily Pivot Point R10.682
Daily Pivot Point R20.6844
Daily Pivot Point R30.6884

Author

Anil Panchal

Anil Panchal

FXStreet

Anil Panchal has nearly 15 years of experience in tracking financial markets. With a keen interest in macroeconomics, Anil aptly tracks global news/updates and stays well-informed about the global financial moves and their implications.

More from Anil Panchal
Share:

Editor's Picks

EUR/USD eyes nine-day EMA barrier after rebounding from 1.1600

EUR/USD gains ground after registering modest losses in the previous session, trading around 1.1620 during the Asian hours on Friday. The technical analysis of the daily chart suggests an ongoing bearish bias as the pair remains within the descending channel pattern.

GBP/USD: Pound Sterling ticks up against US Dollar in countdown to US NFP

The Pound Sterling trades marginally higher to near 1.3365 against the US Dollar during the Asian trading session on Friday. The GBP/USD pair edges up as the US Dollar ticks down ahead of the United States Nonfarm Payrolls data for February, which will be published at 13:30 GMT.

Gold awaits US Nonfarm Payrolls for a clear directional impetus

Gold rebounds above $5,100 early Friday after testing the $5,050 level amid global sell-off. The US Dollar pulls back as profit-taking creeps in ahead of US labor data. For February. 21-day SMA holds amid bullish RSI; a daily closing above 61.8% Fibo is critical for Gold buyers.

Ethereum pull in $169M as validators pile in to stake ETH

US spot Ethereum exchange-traded funds recorded $169 million in net inflows on Wednesday, marking the largest daily intake in two months, according to SoSoValue data. The rise in inflows signals renewed institutional interest in Ethereum amid broader market volatility.

The market compass is pointing at a barrel of Oil

The Asian open is arriving with equities leaning the wrong way, and the reason is not complicated. The market’s compass needle has snapped firmly toward crude. In this tape, oil is not just another input price; it is the gravitational center around which every asset class is orbiting.

Ripple tests recovery strength amid steady ETF inflows, growing retail interest

Ripple (XRP) continues to demonstrate notable resilience as the cryptocurrency market navigates the persistent war in the Middle East after the United States (US) and Israel attacked Iran on Saturday.