|

AUD/USD Price Analysis: Recovers some lost ground near 0.6470 following Australian CPI

  • AUD/USD holds above the 50- and 100-hour EMAs with an upward slope.
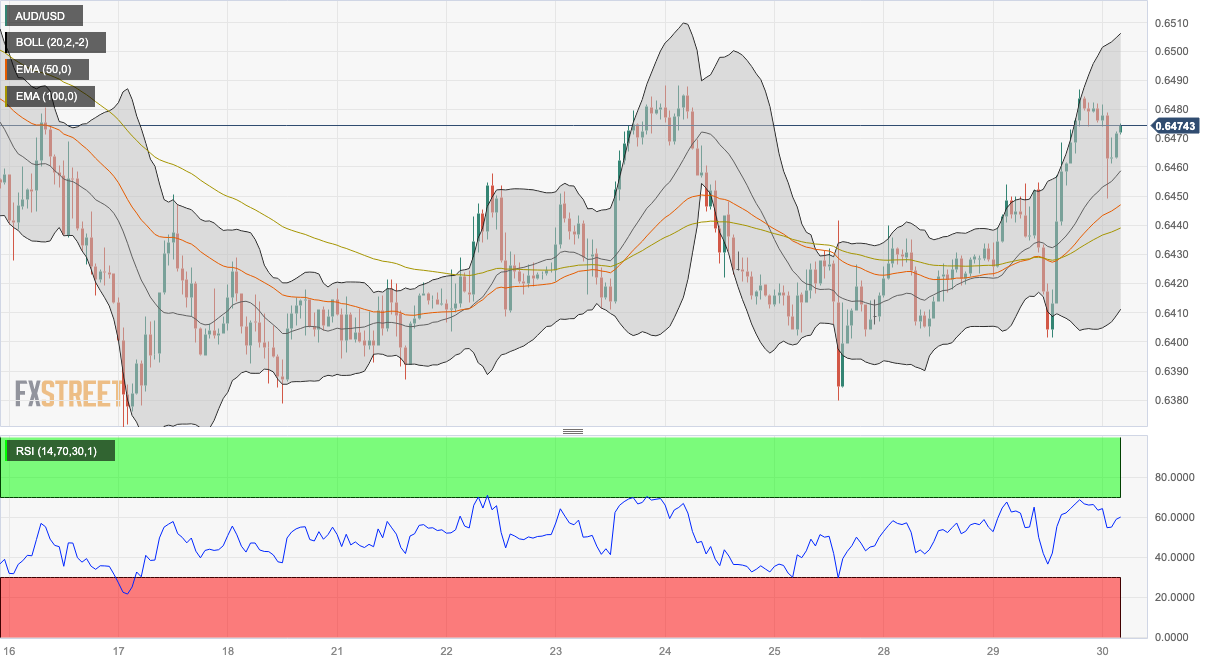
  • The Relative Strength Index (RSI) stands in bullish territory above 50.
  • The immediate resistance level is seen at 0.6485; 0.6445 acts as the initial support level.

The AUD/USD pair recovers some lost ground near 0.6470 after retracing to the 0.6450 low during the early European session on Wednesday. The Australian Dollar (AUD) is under pressure after the monthly Consumer Price Index (CPI) revealed that inflation dropped to a 17-month low in July. This number might convince the Reserve Bank of Australia (RBA) to keep interest rates unchanged in the next policy meeting.

Technically, the AUD/USD pair trades above the 50- and 100-hour Exponential Moving Averages (EMAs) with an upward slope on the one-hour chart, indicating that the path of least resistance for the pair is to the upside.

It’s worth noting that the Relative Strength Index (RSI) stands in bullish territory above 50, challenging the pair’s immediate upside for the time being.

The immediate resistance level for AUD/USD is seen near a high of August 29 at 0.6485. Further north, the 0.6500-0.6505 regions appear a tough nut to crack for Aussie bears. The mentioned level represents the confluence of a psychological round mark, the upper boundary of Bollinger Band, and high of August 14. Any meaningful follow-through buying above the latter could pave the way to 0.6522 (high of August 15) and 0.6570 (high of August 9).

On the downside, the 50-hour EMA at 0.6445 acts as the initial support level for the pair. The additional downside filter to watch is seen at 0.6439 (100-hour EMA). Any intraday pullback below the latter would expose the next contention level at 0.6410 (the lower limit of the Bollinger Band). A decisive breach of the latter will see the next stop at 0.6380 (low of August 25) and finally at 0.6365 (low of August 17).
 

AUD/USD one-hour chart

AUD/USD

Overview
Today last price0.6473
Today Daily Change-0.0007
Today Daily Change %-0.11
Today daily open0.648
 
Trends
Daily SMA200.6477
Daily SMA500.6622
Daily SMA1000.6651
Daily SMA2000.6726
 
Levels
Previous Daily High0.6487
Previous Daily Low0.6401
Previous Weekly High0.6488
Previous Weekly Low0.638
Previous Monthly High0.6895
Previous Monthly Low0.6599
Daily Fibonacci 38.2%0.6454
Daily Fibonacci 61.8%0.6434
Daily Pivot Point S10.6425
Daily Pivot Point S20.6371
Daily Pivot Point S30.634
Daily Pivot Point R10.6511
Daily Pivot Point R20.6542
Daily Pivot Point R30.6597

Author

Lallalit Srijandorn

Lallalit Srijandorn is a Parisian at heart. She has lived in France since 2019 and now becomes a digital entrepreneur based in Paris and Bangkok.

More from Lallalit Srijandorn
Share:

Markets move fast. We move first.

Orange Juice Newsletter brings you expert driven insights - not headlines. Every day on your inbox.

By subscribing you agree to our Terms and conditions.

Editor's Picks

EUR/USD edges above 1.1750 due to ECB-Fed policy divergence

EUR/USD has recovered its recent losses registered in the previous session, trading around 1.1760 during the Asian hours on Friday. Traders will likely observe Germany’s Manufacturing Purchasing Managers’ Index data later in the day.

GBP/USD gathers strength above 1.3450 on Fed rate cut bets, BoE's gradual policy path

The GBP/USD pair gathers strength to around 1.3480 during the early Asian session on Friday. Expectations of the US Federal Reserve rate cuts this year weigh on the US Dollar against the Pound Sterling. Philadelphia Fed President Anna Paulson is set to speak later on the weekend. 

Gold climbs to near $4,350 on Fed rate cut bets, geopolitical risks

Gold price rises to near $4,345 during the early Asian session on Friday. Gold finished 2025 with a significant rally, achieving an annual gain of around 65%, its biggest annual gain since 1979. The rally of the precious metal is bolstered by the prospect of further US interest rate cuts in 2026 and safe-haven flows.

Bitcoin trades in compression as 2026 begins with structure still unresolved

BTC/USD remains locked in a two-way structure, with micro supply-and-demand levels guiding early-year price behaviour.

Economic outlook 2026-2027 in advanced countries: Solidity test

After a year marked by global economic resilience and ending on a note of optimism, 2026 looks promising and could be a year of solid economic performance. In our baseline scenario, we expect most of the supportive factors at work in 2025 to continue to play a role in 2026.

Crypto market outlook for 2026

Year 2025 was volatile, as crypto often is.  Among positive catalysts were favourable regulatory changes in the U.S., rise of Digital Asset Treasuries (DAT), adoption of AI and tokenization of Real-World-Assets (RWA).