- AUD/USD remains pressured within 40-pip rectangle, justifies clear break of short-term ascending trend line, 200-HMA.
- Downbeat oscillators suggest further grinding towards the south.
- Aussie pair buyers need validation from 0.6780; bears have ample room to cheer.
AUD/USD bears return to the table, following an upbeat start of the week, as the Aussie pair drops to 0.6680 amid early Tuesday morning in Europe.
In doing so, the risk barometer remains within a short-term rectangle formation comprising multiple levels marked since the last Friday amid a steady RSI (14) line, below the median line of late.
However, a clear downside break of a fortnight-old ascending trend line and the 200-Hour Moving Average (HMA) joins the bearish MACD signals to keep Aussie bears hopeful.
That said, the stated trend continuation pattern’s lower line, close to 0.6665 of late, puts a floor under the AUD/USD prices, a break of which could quickly direct the sellers towards the monthly low of 0.6620.
In a case where the AUD/USD price remains bearish past 0.6620, the 0.6600 round figure and the yearly low marked in March around 0.6560 could lure the sellers.
On the flip side, the aforementioned rectangle’s top line, around 0.6710 at the latest, precedes the 200-HMA level of 0.6720 to restrict the short-term recovery of the AUD/USD pair.
Following that, the previous support line stretched from April 11, near 0.6725 can act as the last defense of the AUD/USD bears.
Should the AUD/USD buyers keep the reins past 0.6725, a one-week-old horizontal resistance area between 0.6770 and 0.6780 can challenge the upside momentum.
AUD/USD: Hourly chart
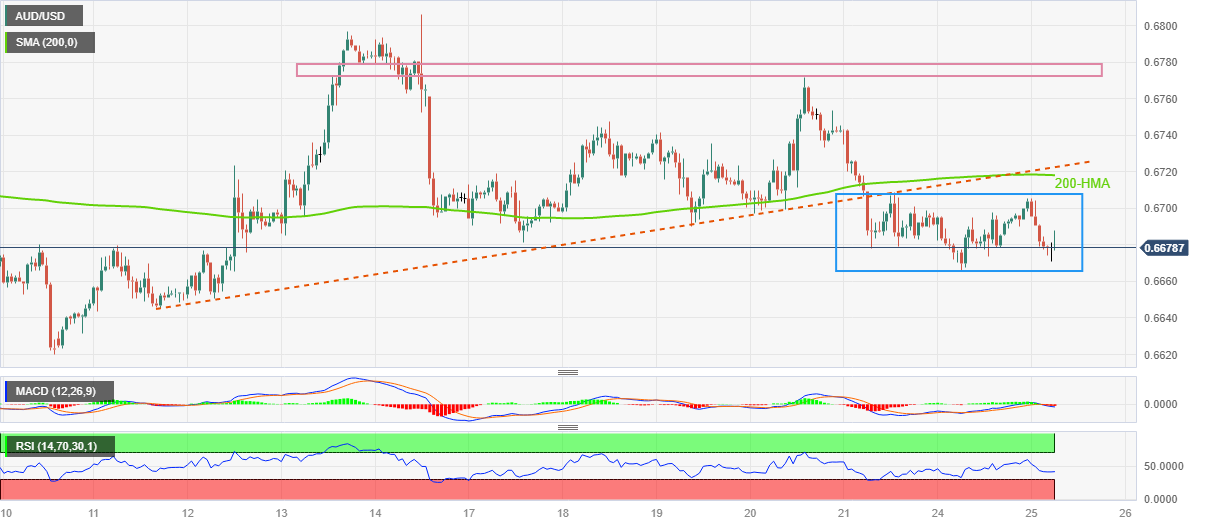
Trend: Further downside expected
Information on these pages contains forward-looking statements that involve risks and uncertainties. Markets and instruments profiled on this page are for informational purposes only and should not in any way come across as a recommendation to buy or sell in these assets. You should do your own thorough research before making any investment decisions. FXStreet does not in any way guarantee that this information is free from mistakes, errors, or material misstatements. It also does not guarantee that this information is of a timely nature. Investing in Open Markets involves a great deal of risk, including the loss of all or a portion of your investment, as well as emotional distress. All risks, losses and costs associated with investing, including total loss of principal, are your responsibility. The views and opinions expressed in this article are those of the authors and do not necessarily reflect the official policy or position of FXStreet nor its advertisers. The author will not be held responsible for information that is found at the end of links posted on this page.
If not otherwise explicitly mentioned in the body of the article, at the time of writing, the author has no position in any stock mentioned in this article and no business relationship with any company mentioned. The author has not received compensation for writing this article, other than from FXStreet.
FXStreet and the author do not provide personalized recommendations. The author makes no representations as to the accuracy, completeness, or suitability of this information. FXStreet and the author will not be liable for any errors, omissions or any losses, injuries or damages arising from this information and its display or use. Errors and omissions excepted.
The author and FXStreet are not registered investment advisors and nothing in this article is intended to be investment advice.


Recommended content
Editors’ Picks

EUR/USD drops below 1.1400 after Germany and EU PMI data
EUR/USD struggles to hold its ground and trades below 1.1400 in the European session on Wednesday. PMI data from Germany and the Eurozone showed that the business activity in the service sector contracted in April. Markets await comments from central bankers and US PMI data.

GBP/USD stays weak near 1.3300 after disappointing UK data
GBP/USD stays under bearish pressure near 1.3300 in the European session on Wednesday. Pound Sterling struggles to find demand following the weaker-than-forecast April PMI data from the UK. BoE Governor Bailey will speak later in the day and the US economic calendar will feature PMI reports.

Gold price takes it on the chin after Trump softens tone on trade and Fed
Gold price is undergoing some profit-taking and sees selling pressure on Wednesday towards $3,300 at the time of writing. The profit taking picked up on comments from United States President Donald Trump, who did a 180-degree turn on his stance on China and the Federal Reserve (Fed). After the closing bell, Tesla’s (TSLA) Chief Executive Officer Elon Musk said he will reduce his role at the Department of Government Efficiency.

Dogecoin lead double-digit gains across meme coins, with Shiba Inu, PEPE and BONK skyrocketing to new monthly highs
Top meme coins Dogecoin, Shiba Inu, PEPE and BONK lead the meme coin sector with double-digit gains on Wednesday following the crypto market recovery.

Five fundamentals for the week: Traders confront the trade war, important surveys, key Fed speech Premium
Will the US strike a trade deal with Japan? That would be positive progress. However, recent developments are not that positive, and there's only one certainty: headlines will dominate markets. Fresh US economic data is also of interest.

The Best brokers to trade EUR/USD
SPONSORED Discover the top brokers for trading EUR/USD in 2025. Our list features brokers with competitive spreads, fast execution, and powerful platforms. Whether you're a beginner or an expert, find the right partner to navigate the dynamic Forex market.