AUD/USD Price Analysis: Oversold RSI, 78.6% Fibonacci ratio check Aussie sellers targeting 0.6300


  • AUD/USD remains depressed at YTD low, prints eight-day downtrend.
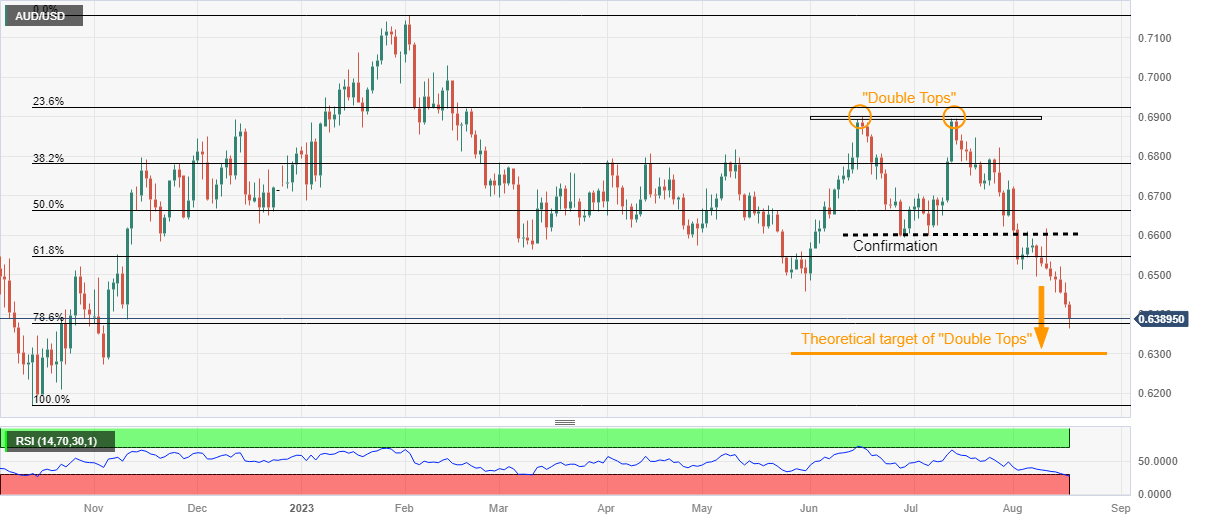
  • RSI (14) line, 78.6% Fibonacci retracement prod south-run aiming theoretical target of “Double Tops”.
  • Corrective bounce can aim for May’s peak but buyers remain off guard below 0.6600.

AUD/USD bears take a breather after refreshing the yearly low as oversold RSI joins the key Fibonacci ratio to mark an unimpressive effort to prod downside. That said, the Aussie pair dropped to 0.6364 before recently poking 0.6390 heading into Thursday’s European session.

That said, the RSI (14) line stays deep into the oversold territory suggesting an imminent corrective bounce. Also challenging the quote’s further weakness is the 78.6% Fibonacci retracement of the AUD/USD pair’s upside from October 2022 to February 2023, close to 0.6375.

With this, the quote could pare some of its latest losses, which in turn highlights the May month’s bottom of around 0.6460 as an immediate upside hurdle. However, lows marked in late June and early July around the 0.6600 round figure appear the key resistance for the AUD/USD buyers to cross to retake control.

It’s worth noting that the AUD/USD pair’s confirmed the “Double Tops” bearish chart formation earlier in the month by breaking the 0.6600 mark. The same suggests the theoretical target of 0.6300 unless the quote stays beneath 0.6600.

In a case where the AUD/USD pair rises past 0.6600, its run-up towards the early July swing high of around 0.6700 and the monthly peak of 0.6725 can’t be ruled out.

Alternatively, a downside break of the 0.6300 theoretical target will direct AUD/USD toward the previous yearly low of around 0.6170.

AUD/USD: Daily chart

Trend: Further downside expected

Additional important levels

Overview
Today last price 0.639
Today Daily Change -0.0034
Today Daily Change % -0.53%
Today daily open 0.6424
 
Trends
Daily SMA20 0.6608
Daily SMA50 0.6688
Daily SMA100 0.6675
Daily SMA200 0.6737
 
Levels
Previous Daily High 0.648
Previous Daily Low 0.6416
Previous Weekly High 0.6617
Previous Weekly Low 0.6486
Previous Monthly High 0.6895
Previous Monthly Low 0.6599
Daily Fibonacci 38.2% 0.6441
Daily Fibonacci 61.8% 0.6456
Daily Pivot Point S1 0.64
Daily Pivot Point S2 0.6375
Daily Pivot Point S3 0.6335
Daily Pivot Point R1 0.6464
Daily Pivot Point R2 0.6505
Daily Pivot Point R3 0.6529


Share: Feed news

Information on these pages contains forward-looking statements that involve risks and uncertainties. Markets and instruments profiled on this page are for informational purposes only and should not in any way come across as a recommendation to buy or sell in these assets. You should do your own thorough research before making any investment decisions. FXStreet does not in any way guarantee that this information is free from mistakes, errors, or material misstatements. It also does not guarantee that this information is of a timely nature. Investing in Open Markets involves a great deal of risk, including the loss of all or a portion of your investment, as well as emotional distress. All risks, losses and costs associated with investing, including total loss of principal, are your responsibility. The views and opinions expressed in this article are those of the authors and do not necessarily reflect the official policy or position of FXStreet nor its advertisers. The author will not be held responsible for information that is found at the end of links posted on this page.

If not otherwise explicitly mentioned in the body of the article, at the time of writing, the author has no position in any stock mentioned in this article and no business relationship with any company mentioned. The author has not received compensation for writing this article, other than from FXStreet.

FXStreet and the author do not provide personalized recommendations. The author makes no representations as to the accuracy, completeness, or suitability of this information. FXStreet and the author will not be liable for any errors, omissions or any losses, injuries or damages arising from this information and its display or use. Errors and omissions excepted.

The author and FXStreet are not registered investment advisors and nothing in this article is intended to be investment advice.

Recommended content


Recommended content

Editors’ Picks

EUR/USD stays below 1.0500 after German and EU PMI data

EUR/USD stays below 1.0500 after German and EU PMI data

EUR/USD stays on the back foot and trades below 1.0500 in the European session on Friday after the data from Germany and the Eurozone showed that the economic activity in the private sector expanded at a moderate pace in February. Investors await US PMIs.

EUR/USD News
GBP/USD retreats to 1.2650 area after mixed UK data

GBP/USD retreats to 1.2650 area after mixed UK data

GBP/USD struggles to gather bullish momentum and stays near 1.2650 in the European session on Friday. Earlier in the day, the upbeat UK Retail Sales helped Pound Sterling find demand but the mixed PMI reports limited the pair's upside. Focus shifts to key US data releases.

GBP/USD News
Gold drops over 1% from Thursday’s all-time high

Gold drops over 1% from Thursday’s all-time high

Gold dives lower and slips below $2,925 on Friday. The Trump administration puts lifting trade bans against Russia on the table. Traders are mulling the upcoming US preliminary S&P PMI data for February. 

Gold News
US S&P Global PMIs set to show healthy services and manufacturing sector in February

US S&P Global PMIs set to show healthy services and manufacturing sector in February

 The S&P Global preliminary PMIs for February are likely to show little variation from the January final readings. The Federal Reserve may resume its easing cycle in July. EUR/USD’s near-term outlook remains negative ahead of PMIs. 

Read more
Money market outlook 2025: Trends and dynamics in the Eurozone, US, and UK

Money market outlook 2025: Trends and dynamics in the Eurozone, US, and UK

We delve into the world of money market funds. Distinct dynamics are at play in the US, eurozone, and UK. In the US, repo rates are more attractive, and bills are expected to appreciate. It's also worth noting that the Fed might cut rates more than anticipated, similar to the UK. In the eurozone, unsecured rates remain elevated.

Read more
The Best brokers to trade EUR/USD

The Best brokers to trade EUR/USD

SPONSORED Discover the top brokers for trading EUR/USD in 2025. Our list features brokers with competitive spreads, fast execution, and powerful platforms. Whether you're a beginner or an expert, find the right partner to navigate the dynamic Forex market.

Read More

Forex MAJORS

Cryptocurrencies

Signatures

Best Brokers of 2025