|

AUD/USD Price Analysis: Looks set for a breakdown of 0.6580 ahead of US NFP

  • AUD/USD looks vulnerable around 0.6580 as USD Index is building a cushion around 105.20.
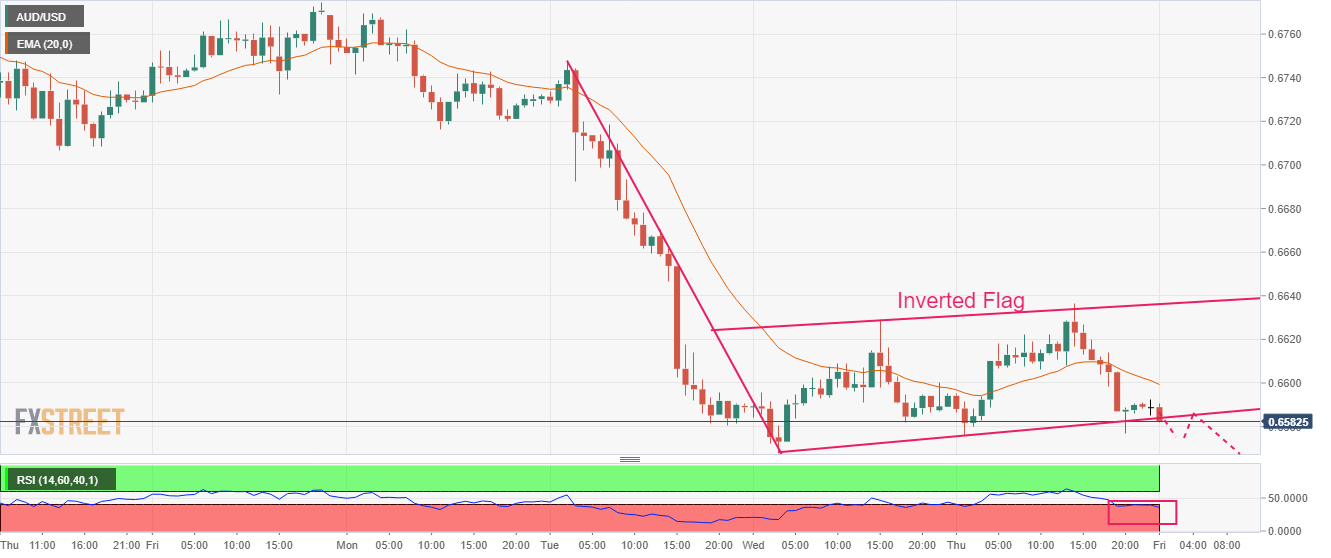
  • An Inverted Flag formation favors downside bias for the Aussie asset.
  • The RSI (14) has slipped into the bearish range of 20.00-40.00, which indicates that the downside momentum has been triggered.

The AUD/USD pair has delivered a less-confident rebound to near 0.6580 in the Asian session. The Aussie asset is navigating in a territory of 0.6580-0.6636 for the past two trading sessions. Investors should brace for sheer volatility as the release of the United States Nonfarm Payrolls (NFP) data will provide clear guidance.

The US Dollar Index (DXY) is building a cushion around 105.20 after a tad longer gradual correction. The release of the US NFP will trigger action moves as it will guide whether the Federal Reserve (Fed) will continue its moderate pace in hiking interest rates or will return to an aggressive rate hike approach.

Meanwhile, the Australian Dollar is expected to remain on tenterhooks as the Reserve Bank of Australia (RBA) has favored pausing policy-tightening ahead despite a one-time decline in the monthly Consumer Price Index (CPI).

AUD/USD is hovering near the edge of the Inverted Flag chart pattern formed on an hourly scale. An Inverted Flag is a trend-following pattern that displays a long consolidation that is followed by a breakdown. Usually, the consolidation phase of the chart pattern serves as an inventory adjustment in which those participants initiate shorts, which prefer to enter an auction after the establishment of a bearish bias.

The 20-period Exponential Moving Average (EMA) at 0.6600 is acting as a major barricade for the Australian Dollar.

Meanwhile, the Relative Strength Index (RSI) (14) has slipped into the bearish range of 20.00-40.00, which indicates that the downside momentum has been triggered.

Going forward, a breakdown of Wednesday’s low at 0.6568 will drag the asset toward the horizontal support plotted from October 4 high at 0.6547 followed by the round-level support at 0.6500.

In an alternate scenario, a break above Wednesday’s high at 0.6629 will push the Aussie asset toward December 22 low at 0.6650. A break above the same might expose the major to February 27 low near 0.6700.

AUD/USD hourly chart

AUD/USD

Overview
Today last price0.6585
Today Daily Change-0.0003
Today Daily Change %-0.05
Today daily open0.6588
 
Trends
Daily SMA200.6794
Daily SMA500.6889
Daily SMA1000.6763
Daily SMA2000.678
 
Levels
Previous Daily High0.6636
Previous Daily Low0.6576
Previous Weekly High0.6784
Previous Weekly Low0.6695
Previous Monthly High0.7158
Previous Monthly Low0.6698
Daily Fibonacci 38.2%0.6599
Daily Fibonacci 61.8%0.6613
Daily Pivot Point S10.6564
Daily Pivot Point S20.654
Daily Pivot Point S30.6504
Daily Pivot Point R10.6624
Daily Pivot Point R20.666
Daily Pivot Point R30.6684

Author

Sagar Dua

Sagar Dua

FXStreet

Sagar Dua is associated with the financial markets from his college days. Along with pursuing post-graduation in Commerce in 2014, he started his markets training with chart analysis.

More from Sagar Dua
Share:

Editor's Picks

EUR/USD looks sidelined below 1.1600

EUR/USD remains on the back foot in the latter part of the NA session on Thursday, now attempting a consolidative theme in the sub-1.1600 region. A more cautious market mood, driven by the escalating conflict in the Middle East, together with broad-based strength in the US Dollar, is favouring the continuation of the leg lower in spot.

GBP/USD stays offered near 1.3340

GBP/USD fades Wednesday’s uptick and trades with decent losses in the 1.3340 zone in the latter part of Thursday’s session. Cable’s weakness, alongside the rest of the risk complex, follows the strong performance of the Greenback amid intense geopolitical jitters.

Gold: further weakness could challenge $5,000

Gold comes under fresh selling pressure on Thursday, slipping back below the $5,100 mark per troy ounce. Persistent strength in the US Dollar (USD) is preventing the yellow metal from building a meaningful recovery, even as markets remain risk-averse amid the deepening conflict in the Middle East.

Crypto Today: Bitcoin, Ethereum, XRP hold weekly gains despite US-Iran war

The cryptocurrency market is gaining strength on Thursday, building on Wednesday's upswing, which saw Bitcoin reach a weekly high above $74,000. Ethereum and Ripple are moderating their recent gains amid uncertainty stemming from the escalating war in the Middle East.

Two PMIs, two Chinas

China’s economic data are often treated with a degree of caution by global investors. The challenge is not necessarily that the numbers are incorrect, but that they can describe very different parts of a vast and complex economy. Nowhere is that more evident than in China’s PMIs.

Ripple tests recovery strength amid steady ETF inflows, growing retail interest

Ripple (XRP) continues to demonstrate notable resilience as the cryptocurrency market navigates the persistent war in the Middle East after the United States (US) and Israel attacked Iran on Saturday.