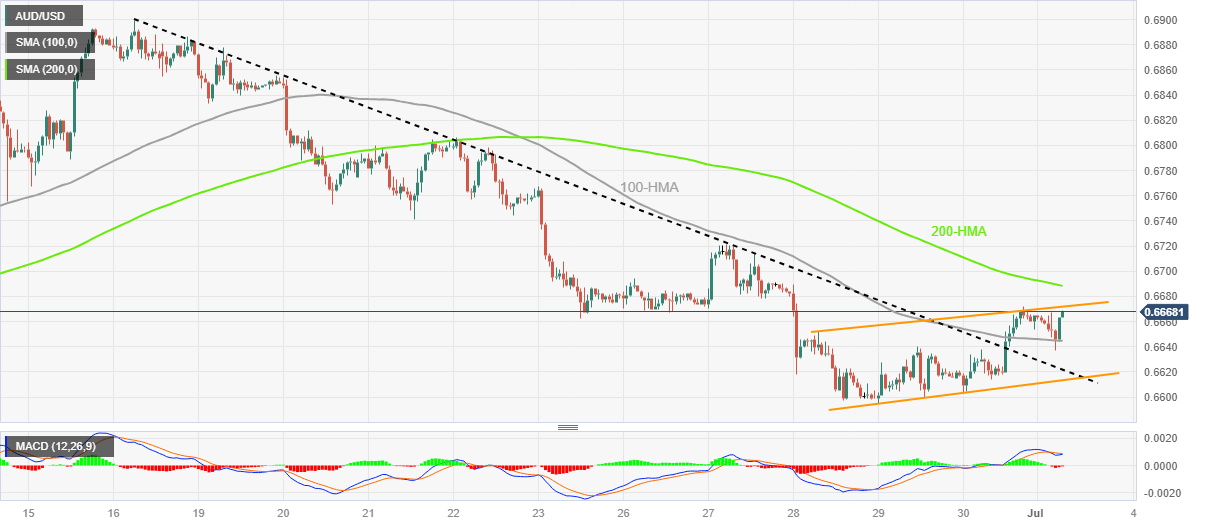
- AUD/USD seesaws around intraday high, struggles to defend three-day winning streak within immediate rising trend channel.
- Clear bounce off 100-HMA lures Aussie buyers despite channel’s top line, 200-HMA prod further upside.
- Bearish consolidation in play, fundamental clues eyed for clear directions ahead of RBA.
AUD/USD bulls struggle around the intraday high of near 0.6665-70 as a short-term key upside hurdle prods the risk-barometer pair’s three-day winning streak amid early Monday in Europe. In doing so, the Aussie pair justifies the trader’s anxiety ahead of Tuesday’s Reserve Bank of Australia (RBA) Interest Rate Decision.
That said, the AUD/USD pair’s latest run-up could be linked to its ability to recover from the 100-Hour Moving Average (HMA). Adding strength to the upside bias is the quote’s sustained break of a downward-sloping resistance line from June 16, now support near 0.6620.
However, an upward-sloping trend channel since the last Wednesday, currently between 0.6670 and 0.6615, restricts the quote’s immediate upside.
It’s worth noting that the major currency pair’s run-up beyond 0.6670 needs validation from the 200-HMA hurdle of around 0.6690, as well as the 0.6700 round figure, to convince the AUD/USD bulls.
Even so, the previous weekly high of 0.6720 can challenge the pair ahead of directing the run-up toward the 0.6800 round figure and then to the last monthly peak of near 0.6820.
Meanwhile, the 100-HMA and the previous resistance line, respectively near 0.6645 and 0.6620, restrict the short-term downside of the AUD/USD pair.
Following that, the stated channel’s bottom line and the monthly low, close to 0.6615 and 0.6595 in that order, will act as the final defense of the Aussie pair bears.
AUD/USD: Hourly chart
Trend: Limited upside expected
Information on these pages contains forward-looking statements that involve risks and uncertainties. Markets and instruments profiled on this page are for informational purposes only and should not in any way come across as a recommendation to buy or sell in these assets. You should do your own thorough research before making any investment decisions. FXStreet does not in any way guarantee that this information is free from mistakes, errors, or material misstatements. It also does not guarantee that this information is of a timely nature. Investing in Open Markets involves a great deal of risk, including the loss of all or a portion of your investment, as well as emotional distress. All risks, losses and costs associated with investing, including total loss of principal, are your responsibility. The views and opinions expressed in this article are those of the authors and do not necessarily reflect the official policy or position of FXStreet nor its advertisers. The author will not be held responsible for information that is found at the end of links posted on this page.
If not otherwise explicitly mentioned in the body of the article, at the time of writing, the author has no position in any stock mentioned in this article and no business relationship with any company mentioned. The author has not received compensation for writing this article, other than from FXStreet.
FXStreet and the author do not provide personalized recommendations. The author makes no representations as to the accuracy, completeness, or suitability of this information. FXStreet and the author will not be liable for any errors, omissions or any losses, injuries or damages arising from this information and its display or use. Errors and omissions excepted.
The author and FXStreet are not registered investment advisors and nothing in this article is intended to be investment advice.
Recommended content
Editors’ Picks

EUR/USD recovers toward 1.0500 after mixed US PMI data
EUR/USD rebounds toward 1.0500 in the American session on Friday after the data from the US showed that the business activity in the private sector expanded at a softer pace than anticipated in early February. The pair remains on track to end the week with little changed.

GBP/USD rises above 1.2650, looks to post weekly gains
GBP/USD regains its traction and trades above 1.2650 in the second half of the day on Friday. The data from the US showed that the S&P Global Services PMI dropped into the contraction territory below 50 in February, causing the US Dollar to lose strength and helping the pair edge higher.

Gold holds above $2,930 as US yields edge lower
Gold holds above $2,930 after correcting from the record-high it set above $2,950 on Thursday. Following the mixed PMI data from the US, the benchmark 10-year US Treasury bond yield stays in negative territory below 4.5% and allows XAU/USD to hold its ground.

Crypto exchange Bybit hacked for $1.4 billion worth of ETH
Following a security breach first spotted by crypto investigator ZachXBT, crypto exchange Bybit announced that it suffered a hack where an attacker compromised one of its ETH wallets.

Money market outlook 2025: Trends and dynamics in the Eurozone, US, and UK
We delve into the world of money market funds. Distinct dynamics are at play in the US, eurozone, and UK. In the US, repo rates are more attractive, and bills are expected to appreciate. It's also worth noting that the Fed might cut rates more than anticipated, similar to the UK. In the eurozone, unsecured rates remain elevated.

The Best brokers to trade EUR/USD
SPONSORED Discover the top brokers for trading EUR/USD in 2025. Our list features brokers with competitive spreads, fast execution, and powerful platforms. Whether you're a beginner or an expert, find the right partner to navigate the dynamic Forex market.
