- AUD/USD has found support after sheer selling pressures inspired by weak inflation in China.
- Expectations have increased that inflation would further turn sticky as June wage numbers seem uncomfortable for the Fed policymakers.
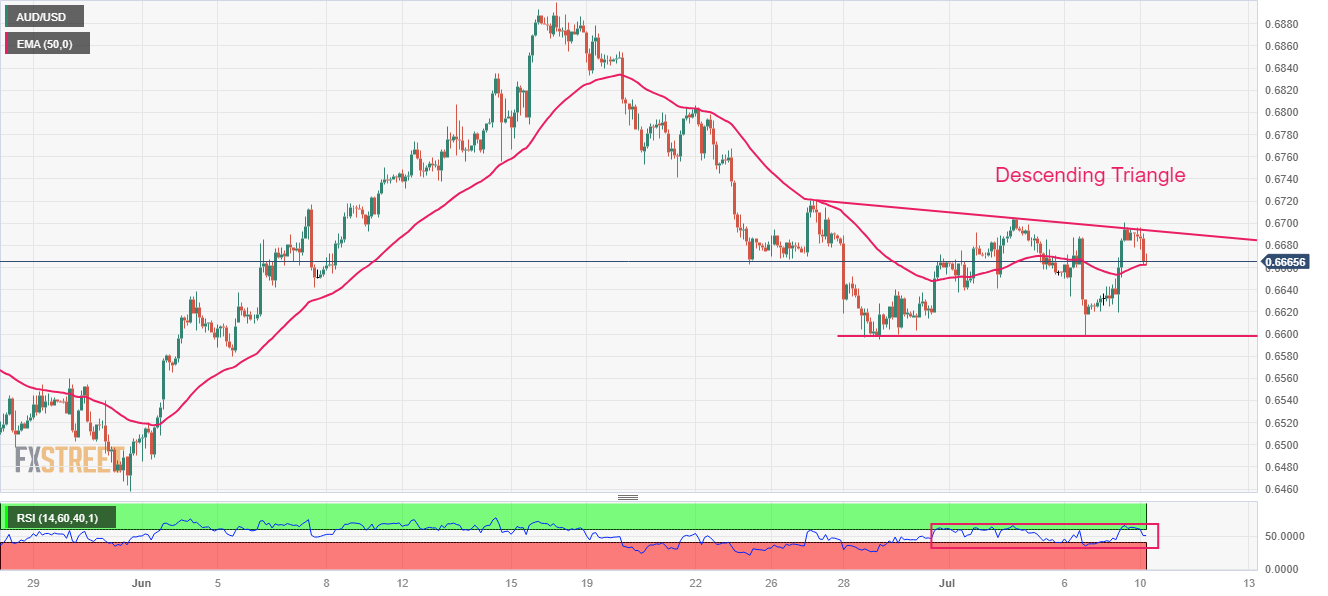
- AUD/USD has faced stiff barricades near the downward-sloping trendline of the Descending Triangle pattern.
The AUD/USD pair has found intermediate support near the crucial support of 0.6660 in the Asian session. The Aussie asset is expected to continue its downside journey amid headwinds of a significantly low Consumer Price Index (CPI) in China and expectations that inflation in the United States will remain stubborn.
Monthly inflation in China for June remained stagnant vs. a figure of 0.2%. Annual CPI remained decelerated at 0.2%, similar to its prior release. Meanwhile, the annual Producer Price Index (PPI) has further decelerated to -5.4% vs. the former release of -4.6%. Lower factory-gate prices indicate that domestic and export demand is extremely vulnerable.
On the United States Dollar front, expectations have increased that inflation would further turn sticky as June wage numbers seem uncomfortable for the Federal Reserve (Fed) policymakers. Monthly economic data maintained a pace of 0.4% and remained higher than the consensus of 0.3%. Also, Annualized Average Hourly Earnings remained at a steady pace of 4.4%.
AUD/USD has faced stiff barricades near the downward-sloping trendline of the Descending Triangle chart pattern formed on a two-hour scale. The downward-sloping trendline of the aforementioned pattern is plotted from June 27 high at 0.6720 while the horizontal support is placed from June 29 low at 0.6595.
The 50-period Exponential Moving Average (EMA) at 0.6620 is providing some cushion to the Australian Dollar bulls.
Meanwhile, the Relative Strength Index (RSI) (14) is oscillating in the 40.00-60.00 range, portraying a non-directional performance.
A confident break June 29 low at 0.6595 would drag the asset toward June 02 low at 0.6565 and the round-level support at 0.6500.
On the flip side, a decisive break above July 04 high at 0.6705 would expose the asset to June 23 high at 0.6767, followed by the round-level resistance at 0.6800.
AUD/USD two-hour chart
Information on these pages contains forward-looking statements that involve risks and uncertainties. Markets and instruments profiled on this page are for informational purposes only and should not in any way come across as a recommendation to buy or sell in these assets. You should do your own thorough research before making any investment decisions. FXStreet does not in any way guarantee that this information is free from mistakes, errors, or material misstatements. It also does not guarantee that this information is of a timely nature. Investing in Open Markets involves a great deal of risk, including the loss of all or a portion of your investment, as well as emotional distress. All risks, losses and costs associated with investing, including total loss of principal, are your responsibility. The views and opinions expressed in this article are those of the authors and do not necessarily reflect the official policy or position of FXStreet nor its advertisers. The author will not be held responsible for information that is found at the end of links posted on this page.
If not otherwise explicitly mentioned in the body of the article, at the time of writing, the author has no position in any stock mentioned in this article and no business relationship with any company mentioned. The author has not received compensation for writing this article, other than from FXStreet.
FXStreet and the author do not provide personalized recommendations. The author makes no representations as to the accuracy, completeness, or suitability of this information. FXStreet and the author will not be liable for any errors, omissions or any losses, injuries or damages arising from this information and its display or use. Errors and omissions excepted.
The author and FXStreet are not registered investment advisors and nothing in this article is intended to be investment advice.
Recommended content
Editors’ Picks

Gold races toward $3,150, at record highs amid tariff woes
Gold price stretches its record-setting rally toward $3,150 in European trading on Monday. The bullion continues to capitalize on safe-haven flows amid intesifying global tariff war fears. US economic concerns weigh on the US Dollar and Treasury yields, aiding the Gold price upsurge.

EUR/USD defends gains below 1.0850 ahead of German inflation data
EUR/USD is holding mild gains while below 1.0850 in early Europe on Monday. The pair draw support from a broadly weaker US Dollar but buyers stay cautious ahead of Germany's prelim inflation data and Trump's reciprocal tariff announcement.

GBP/USD posts small gains near 1.2950 amid tariff woes
GBP/USD keeps the green near 1.2950 in the European morning on Monday. Concerns that US President Donald Trump's tariffs will ignite inflation and dampen economic growth weigh on the US Dollar and act as a tailwind for the pair.

Crypto market sheds over $130B in market cap on Trump tariff uncertainties
The crypto market lost over $130 billion in market capitalization the previous week. Major cryptocurrencies like Bitcoin, Ethereum, Ripple, and Solana fell 5.9%, 10.9%, 15% and 10.1%, respectively, according to CoinGecko data.

US: Trump's 'Liberation day' – What to expect?
Trump has so far enacted tariff changes that have lifted the trade-weighted average tariff rate on all US imports by around 5.5-6.0%-points. While re-rerouting of trade will decrease the effectiveness of tariffs over time, the current level is already close to the highest since the second world war.

The Best brokers to trade EUR/USD
SPONSORED Discover the top brokers for trading EUR/USD in 2025. Our list features brokers with competitive spreads, fast execution, and powerful platforms. Whether you're a beginner or an expert, find the right partner to navigate the dynamic Forex market.