AUD/USD Price Analysis: Bulls counting on a break of symmetrical triangle resistance


  • AUD/USD monitored for a bullish breakout of the symmetrical daily triangle. 
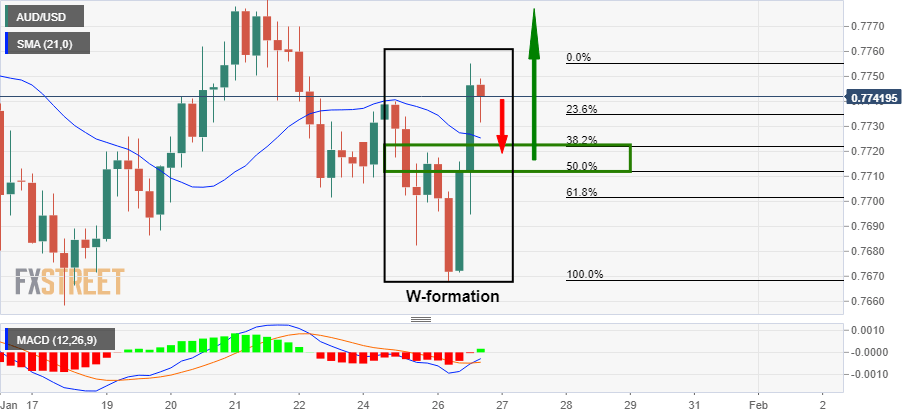
  • 4-hour W-formation's neckline will be eyed for a test and a subsequent demand area within the triangle. 

AUD/USD's medium-term outlook is bearish considering the correction that is to be expected on the longer-term time frames following two consecutive months of bullish impulses. 

Longer-term, there could still be more upside to follow from a healthy bearish correction. 

Meanwhile, the current state of play is less clear, but the following top-down analysis unravels the price action and illustrates where the next trading opportunities could arise from within the market structure. 

Monthly chart

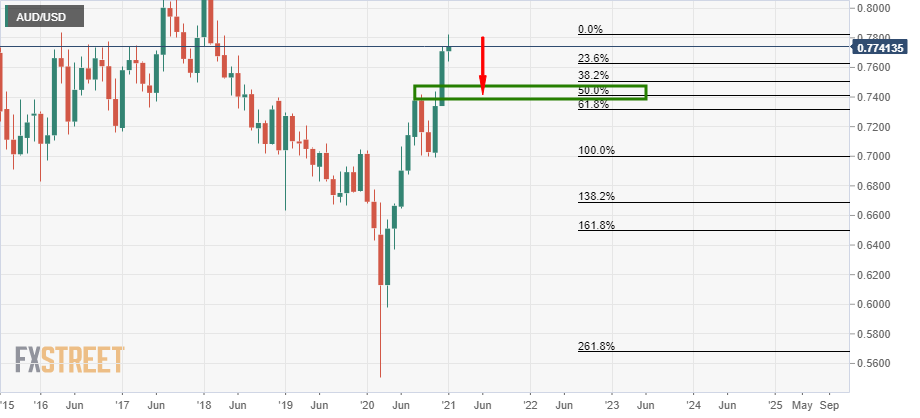
As can be seen, the bullish trend could be due for a correction towards old highs and the confluence of a 50% mean reversion. 

Net AUD positions held in positive territory for a second week and could be trimmed and reflected in the spot market in the coming days and/or weeks. 

However, that is not to say that a continuation in the spot market can be ruled out for there has been no sign of slowing momentum and the 2018 highs.

Presumed resistance towards 0.80 is still some way off yet.  

Weekly chart

The weekly chart is somewhat less bullish as we are seeing signs that the trend is tiring from a closer inspection. 

There is a demand area that could well be tested and it would be not surprising if it were to guard the monthly 50% mean reversion level. 

Daily charts

The daily chart is a complex mix which is broken down into various parts as follows:

Overall, we are seeing a symmetrical triangle that could either act as a top or result in an upside continuation pattern:

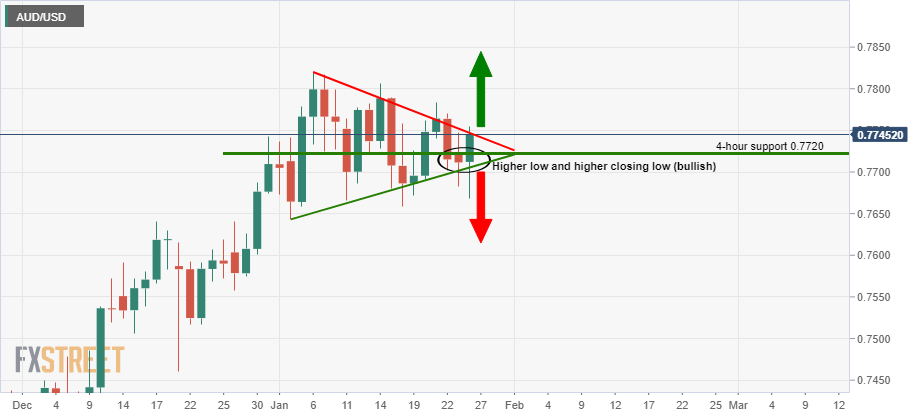
The combination of the higher low and 4-hour support are explained below. 

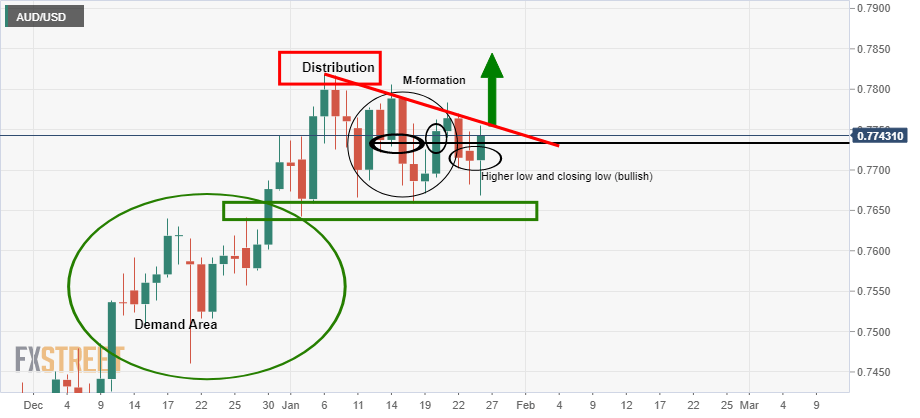
This is where the complexity of the market structure is broken down.

In the above chart, we are seeing where the price is being sold by sellers in a phase of distribution by the less committed bulls. 

The price action then resulted in an M-formation.

After an M-formation the price is expected to retest the neckline of the M-formation which usually coincides with a 38.2% or 50% Fibonacci retracement level as a confluence.  

The confluence would be expected to result in resistance and the distribution phase to continue, resulting in gina top and lower lows.

However, in this case, it did not and the price went on to break the area and print a strong high.

The correction of this impulse resulted in a higher low a closing low. This means that buyers are active and leaves a bullish bias on the charts, albeit still within the distribution zone. 

A subsequent break of trendline resistance, however, would be expected to result in a fresh daily impulse to the upside and pull in demand from the committed bulls targeting the 0.80s. 

The following is a chart that illustrates the M-formation more clearly:

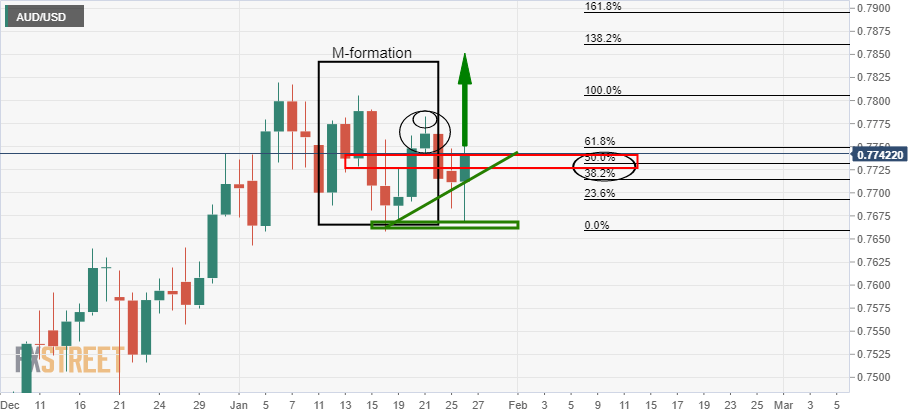
Note the strong high through the neckline as well as the supportive trendline of the correction and bullish bias.

4-hour chart

Meanwhile, there is a bearish bias on the lower time frames.

Bulls may need to wait for the test of the W-formation's neckline and 21 moving average on the 4-hour chart at 0.7720 with a confluence of the 38.2% or 50% Fibonacci retracement levels.

A subsequent hold there would reinforce the upside bias and bullish breakout of the daily symmetrical triangle. 

Share: Feed news

Information on these pages contains forward-looking statements that involve risks and uncertainties. Markets and instruments profiled on this page are for informational purposes only and should not in any way come across as a recommendation to buy or sell in these assets. You should do your own thorough research before making any investment decisions. FXStreet does not in any way guarantee that this information is free from mistakes, errors, or material misstatements. It also does not guarantee that this information is of a timely nature. Investing in Open Markets involves a great deal of risk, including the loss of all or a portion of your investment, as well as emotional distress. All risks, losses and costs associated with investing, including total loss of principal, are your responsibility. The views and opinions expressed in this article are those of the authors and do not necessarily reflect the official policy or position of FXStreet nor its advertisers. The author will not be held responsible for information that is found at the end of links posted on this page.

If not otherwise explicitly mentioned in the body of the article, at the time of writing, the author has no position in any stock mentioned in this article and no business relationship with any company mentioned. The author has not received compensation for writing this article, other than from FXStreet.

FXStreet and the author do not provide personalized recommendations. The author makes no representations as to the accuracy, completeness, or suitability of this information. FXStreet and the author will not be liable for any errors, omissions or any losses, injuries or damages arising from this information and its display or use. Errors and omissions excepted.

The author and FXStreet are not registered investment advisors and nothing in this article is intended to be investment advice.

Recommended content


Recommended content

Editors’ Picks

EUR/USD clings to recovery gains near 1.0850 ahead of Fedspeak

EUR/USD clings to recovery gains near 1.0850 ahead of Fedspeak

EUR/USD trades in positive territory near 1.0850 on Friday following a four-day slide. China's stimulus optimism and a broad US Dollar correction help the pair retrace the dovish ECB decision-induced decline. All eyes remain on the Fedspeak. 

EUR/USD News
GBP/USD pares UK data-led gains at around 1.3050

GBP/USD pares UK data-led gains at around 1.3050

GBP/USD is trading at around 1.3050 in the second half of the day on Friday, supported by upbeat UK Retail Sales data and a pullback seen in the US Dollar. Later in the day, comments from Federal Reserve officials will be scrutinized by market participants.

GBP/USD News
Gold at new record peaks above $2,700 on increased prospects of global easing

Gold at new record peaks above $2,700 on increased prospects of global easing

Gold (XAU/USD) establishes a foothold above the $2,700 psychological level on Friday after piercing through above this level on the previous day, setting yet another fresh all-time high. Growing prospects of a globally low interest rate environment boost the yellow metal.

Gold News
Crypto ETF adoption should pick up pace despite slow start, analysts say

Crypto ETF adoption should pick up pace despite slow start, analysts say

Big institutional investors are still wary of allocating funds in Bitcoin spot ETFs, delaying adoption by traditional investors. Demand is expected to increase in the mid-term once institutions open the gates to the crypto asset class.

Read more
Canada debates whether to supersize rate cuts

Canada debates whether to supersize rate cuts

A fourth consecutive Bank of Canada rate cut is expected, but the market senses it will accelerate the move towards neutral policy rates with a 50bp step change. Inflation is finally below target and unemployment is trending higher, but the economy is still growing.

Read more
Best Forex Brokers with Low Spreads

Best Forex Brokers with Low Spreads

VERIFIED Low spreads are crucial for reducing trading costs. Explore top Forex brokers offering competitive spreads and high leverage. Compare options for EUR/USD, GBP/USD, USD/JPY, and Gold.

Read More

Forex MAJORS

Cryptocurrencies

Signatures