|

AUD/USD Price Analysis: Breaks monthly support line on fresh US-China tension

  • AUD/USD drops around 15-pips following the news suggesting Beijing’s readiness for a military drill in the South China Sea.
  • Bearish MACD, break of short-term key support favor sellers.
  • Eight-day-old resistance line adds to the upside filters.

AUD/USD prints 0.32% intraday losses, currently heavy near the day’s low of 0.7684, ahead of Tuesday’s European session. In doing so, the aussie pair drops below an upward sloping trend line from December 28 amid bearish MACD signals.

The pair recently got sold after news crossed wires that China will conduct military drills in the South China Sea amid tensions with the US. The dragon nation seems in a mood to escalate the Sino-American tussle after the US aircraft carrier group recently entered the disputed waters.

Read: S&P 500 futures drop further as China says to conduct military drills in South China Sea

Despite the quote’s sustained downside break of the previous support line and a risk-off mood, 200-bar SMA near 0.7665, followed by the monthly low around 0.7640, will challenge the AUD/USD sellers.

In a case where the AUD/USD bears dominate past-0.7640, December 28 low near 0.7560 becomes the key support to watch before the previous month’s bottom surrounding 0.7460.

Meanwhile, an upside bounce beyond the previous support line, now resistance, near 0.7700 threshold, will have to cross a short-term falling resistance line, currently around 0.7760 to recall the AUD/USD buyers.

AUD/USD four-hour chart

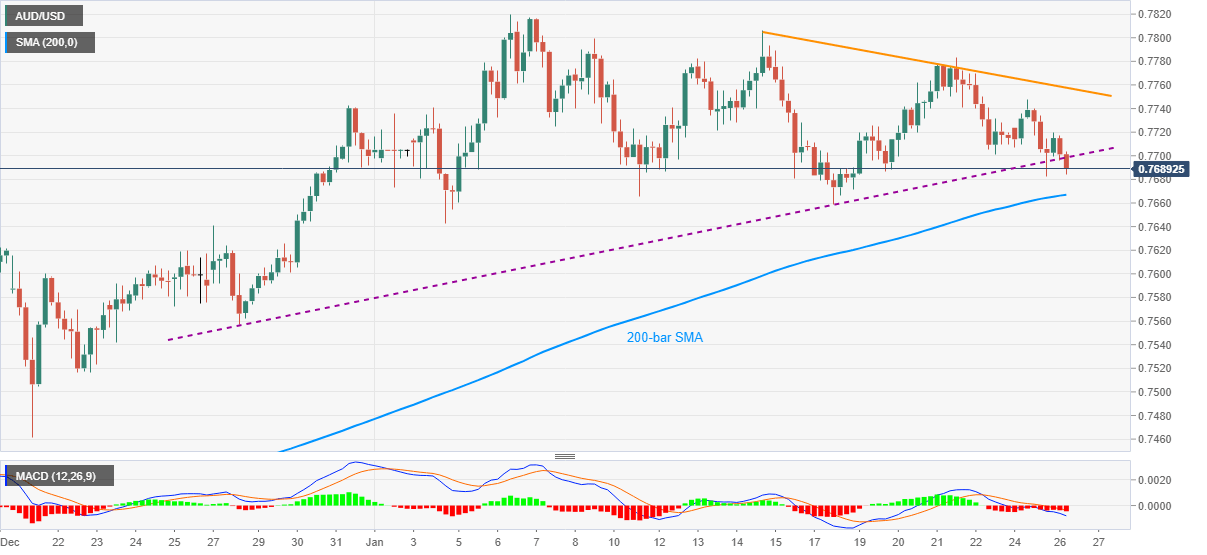
Trend: Further weakness expected

Additional important levels

Overview
Today last price0.7689
Today Daily Change-23 pips
Today Daily Change %-0.30%
Today daily open0.7712
 
Trends
Daily SMA200.7724
Daily SMA500.7563
Daily SMA1000.7369
Daily SMA2000.7133
 
Levels
Previous Daily High0.7748
Previous Daily Low0.7682
Previous Weekly High0.7783
Previous Weekly Low0.7658
Previous Monthly High0.7743
Previous Monthly Low0.7338
Daily Fibonacci 38.2%0.7708
Daily Fibonacci 61.8%0.7723
Daily Pivot Point S10.768
Daily Pivot Point S20.7648
Daily Pivot Point S30.7614
Daily Pivot Point R10.7746
Daily Pivot Point R20.778
Daily Pivot Point R30.7811

Author

Anil Panchal

Anil Panchal

FXStreet

Anil Panchal has nearly 15 years of experience in tracking financial markets. With a keen interest in macroeconomics, Anil aptly tracks global news/updates and stays well-informed about the global financial moves and their implications.

More from Anil Panchal
Share:

Markets move fast. We move first.

Orange Juice Newsletter brings you expert driven insights - not headlines. Every day on your inbox.

By subscribing you agree to our Terms and conditions.

Editor's Picks

EUR/USD stays defensive below 1.1750 as USD finds its feet

EUR/USD kicks off the new week on a softer note, holding below 1.1750 in European trading on Monday. The pair faces challenges due to a pause in the US Dollar downtrend, with traders shifting their focus to the delayed US Nonfarm Payrolls and CPI data for fresh directives. The ECB policy decision is also eagerly awaited. 

GBP/USD holds steady above 1.3350 as traders await key data and BoE

GBP/USD remains on the back foot above 1.3350 in the European session on Monday, though it lacks bearish conviction and holds above the key 200-day SMA support. The US Dollar holds its recovery mode ahead of key data releases, while the Pound Sterling faces headwinds from the expected BoE rate cut this week. 

Gold climbs to seven-week highs on Fed rate cut bets, safe-haven demand

Gold price rises to seven-week highs to near $4,350 during the early European trading hours on Monday. The precious metal extends its upside amid the prospect of interest rate cuts by the US Fed next year. Lower interest rates could reduce the opportunity cost of holding Gold, supporting the non-yielding precious metal.

Solana consolidates as spot ETF inflows near $1 billion signal institutional dip-buying

Solana price hovers above $131 at the time of writing on Monday, nearing the upper boundary of a falling wedge pattern, awaiting a decisive breakout. On the institutional side, demand for spot Solana Exchange-Traded Funds remained firm, pushing total assets under management to nearly $1 billion since launch. 

Big week ends with big doubts

The S&P 500 continued to push higher yesterday as the US 2-year yield wavered around the 3.50% mark following a Federal Reserve (Fed) rate cut earlier this week that was ultimately perceived as not that hawkish after all. The cut is especially boosting the non-tech pockets of the market.

Solana Price Forecast: SOL consolidates as spot ETF inflows near $1 billion signal institutional dip-buying

Solana (SOL) price hovers above $131 at the time of writing on Monday, nearing the upper boundary of a falling wedge pattern, awaiting a decisive breakout.