AUD/USD Price Analysis: Breaks above 0.6660 as USD Index continues downside journey


  • AUD/USD has climbed above 0.6660 amid further weakness in the USD Index.
  • Fed’s Kashkari sees inflation at middle 3% by end of this year, closer to 2% next year.
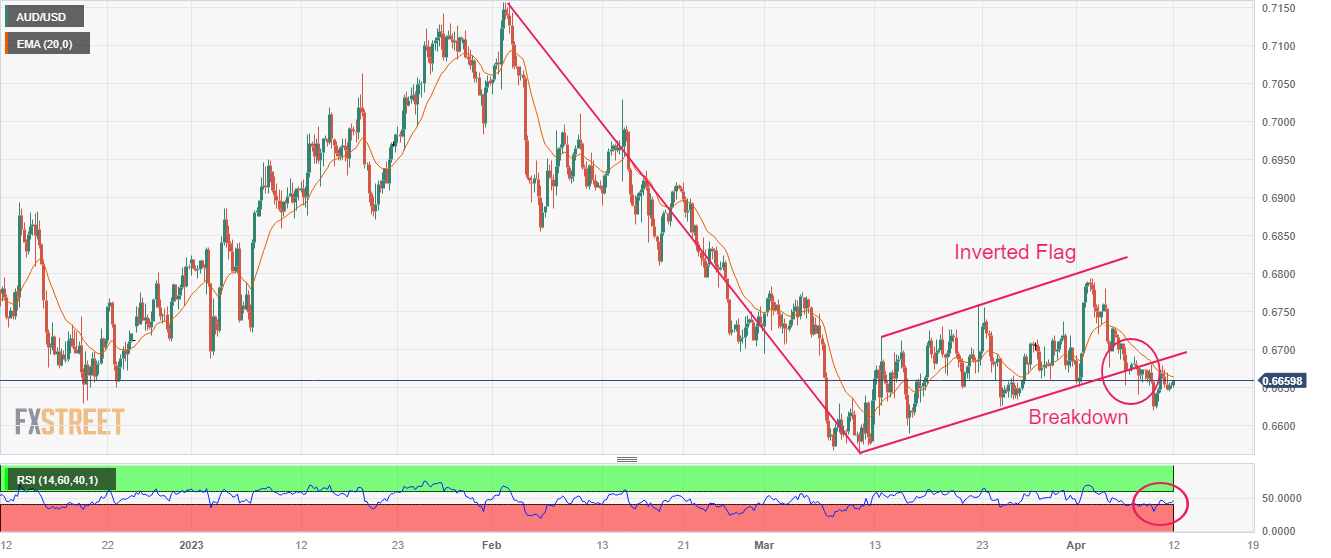
  • AUD/USD has delivered a breakdown of the Inverted Flag chart pattern.

The AUD/USD pair has delivered an upside break of a small consolidation above 0.6660 in the Asian session. The Aussie asset is getting traction as the US Dollar Index (DXY) has resumed its downside journey ahead of the release of the United States Consumer Price Index (CPI) data. The USD Index is likely to test the 102.00 cushion as investors are taking the release of US inflation casually.

S&P500 futures are holding nominal gains after a sideways Tuesday, portraying anxiety ahead of the quarterly result season. The demand for US government bonds has remained subdued as US inflation is expected to be a surprise for investors. The 10-year US Treasury yields is hovering around 3.43%.

Medium-term guidance on US inflation from Minneapolis Fed Bank President Neel Kashkari is weighing on the US Dollar. Fed policymaker sees inflation at middle 3% by end of this year, closer to 2% next year.

On the technical front, AUD/USD has delivered a breakdown of the Inverted Flag chart pattern formed on a four-hour scale. A breakdown of the Inverted Flag results in wider ticks and heavy volume towards the downside.

The 20-period Exponential Moving Average (EMA) at 0.6665 is acting as a barricade for the Aussie bulls.

Contrary to that, the Relative Strength Index (RSI) (14) has shifted into the 40.00-60.00 range from the bearish range of 20.00-40.00.

Going forward, more weakness will be observed on a breakdown of April 10 low at 0.6620, which will expose the Aussie asset to March 10 low at 0.6564 followed by the round-level support at 0.6500.

In an alternate scenario, a break above April 07 high at 0.6691 will drive the asset toward March 22 high at 0.6759. A breach above the latter would further drive the asset to April 03 high at 0.6693.

AUD/USD four-hour chart

AUD/USD

Overview
Today last price 0.6659
Today Daily Change 0.0006
Today Daily Change % 0.09
Today daily open 0.6653
 
Trends
Daily SMA20 0.6686
Daily SMA50 0.6767
Daily SMA100 0.68
Daily SMA200 0.6746
 
Levels
Previous Daily High 0.668
Previous Daily Low 0.6632
Previous Weekly High 0.6793
Previous Weekly Low 0.6641
Previous Monthly High 0.6784
Previous Monthly Low 0.6564
Daily Fibonacci 38.2% 0.6661
Daily Fibonacci 61.8% 0.665
Daily Pivot Point S1 0.663
Daily Pivot Point S2 0.6607
Daily Pivot Point S3 0.6582
Daily Pivot Point R1 0.6678
Daily Pivot Point R2 0.6703
Daily Pivot Point R3 0.6726


Share: Feed news

Information on these pages contains forward-looking statements that involve risks and uncertainties. Markets and instruments profiled on this page are for informational purposes only and should not in any way come across as a recommendation to buy or sell in these assets. You should do your own thorough research before making any investment decisions. FXStreet does not in any way guarantee that this information is free from mistakes, errors, or material misstatements. It also does not guarantee that this information is of a timely nature. Investing in Open Markets involves a great deal of risk, including the loss of all or a portion of your investment, as well as emotional distress. All risks, losses and costs associated with investing, including total loss of principal, are your responsibility. The views and opinions expressed in this article are those of the authors and do not necessarily reflect the official policy or position of FXStreet nor its advertisers. The author will not be held responsible for information that is found at the end of links posted on this page.

If not otherwise explicitly mentioned in the body of the article, at the time of writing, the author has no position in any stock mentioned in this article and no business relationship with any company mentioned. The author has not received compensation for writing this article, other than from FXStreet.

FXStreet and the author do not provide personalized recommendations. The author makes no representations as to the accuracy, completeness, or suitability of this information. FXStreet and the author will not be liable for any errors, omissions or any losses, injuries or damages arising from this information and its display or use. Errors and omissions excepted.

The author and FXStreet are not registered investment advisors and nothing in this article is intended to be investment advice.

XM
Account
7.2
Tools
9.2
Service
9.4
Trading
9.0
Trust
7.0
Experience
8.4
Read review
Moneta Markets
Account
7.4
Tools
6.6
Service
8.0
Trading
6.6
Trust
5.2
Experience
9.2
Read review
Trading Pro
Account
7.2
Tools
5.2
Service
6.6
Trading
8.0
Trust
5.0
Experience
7.0
Read review
Pepperstone
Account
8.2
Tools
8.2
Service
7.4
Trading
9.0
Trust
8.8
Experience
9.0
Read review
XM
Read review
Moneta Markets
Read review
Trading Pro
Read review
Pepperstone
Read review
Trading Pro
Read review
Pepperstone
Read review
XM
Read review
Moneta Markets
Read review
Trading Pro
Account
7.2
Tools
5.2
Service
6.6
Trading
8.0
Trust
5.0
Experience
7.0
Read review
Pepperstone
Account
8.2
Tools
8.2
Service
7.4
Trading
9.0
Trust
8.8
Experience
9.0
Read review
XM
Account
7.2
Tools
9.2
Service
9.4
Trading
9.0
Trust
7.0
Experience
8.4
Read review
Moneta Markets
Account
7.4
Tools
6.6
Service
8.0
Trading
6.6
Trust
5.2
Experience
9.2
Read review

Recommended content


Recommended content

Editors’ Picks

ECB reduces rates by 25 bps as largely expected – LIVE

ECB reduces rates by 25 bps as largely expected – LIVE

On Thursday, the ECB delivered the 25 bps cut everyone expected, trimming the Deposit Facility Rate to 2.25%. EUR/USD remained within its daily sideline theme around the 1.1350-1.1360 band in the wake of the release. Now, all eyes are on Christine Lagarde’s live press conference as investors hang on her every word for clues about what comes next.

FOLLOW US LIVE
GBP/USD trades in an inconclusive fashion around 1.3230

GBP/USD trades in an inconclusive fashion around 1.3230

GBP/USD is stuck in the 1.3250–1.3260 corridor on Thursday, maintaining a rangebound mood in response to the acceptable bounce in the Greenback and the generalised offered bias in the broad risk-linked galaxy.

GBP/USD News
Gold remains affered, recedes to the $3,340 area post-ECB

Gold remains affered, recedes to the $3,340 area post-ECB

Gold powered to a fresh record, flirting with the $3,360 area per troy ounce, before embarking on a correction to the current $3,340 zone, always on the back of the decent rebound in the US Dollar and the recovery in US Treasury yields across the curve.

Gold News
Crypto market cap fell more than 18% in Q1, wiping out $633.5 billion after Trump’s inauguration top

Crypto market cap fell more than 18% in Q1, wiping out $633.5 billion after Trump’s inauguration top

CoinGecko’s Q1 Crypto Industry Report highlights that the total crypto market capitalization fell by 18.6% in the first quarter, wiping out $633.5 billion after topping on January 18, just a couple of days ahead of US President Donald Trump’s inauguration.

Read more
Future-proofing portfolios: A playbook for tariff and recession risks

Future-proofing portfolios: A playbook for tariff and recession risks

It does seem like we will be talking tariffs for a while. And if tariffs stay — in some shape or form — even after negotiations, we’ll likely be talking about recession too. Higher input costs, persistent inflation, and tighter monetary policy are already weighing on global growth. 

Read more
The Best brokers to trade EUR/USD

The Best brokers to trade EUR/USD

SPONSORED Discover the top brokers for trading EUR/USD in 2025. Our list features brokers with competitive spreads, fast execution, and powerful platforms. Whether you're a beginner or an expert, find the right partner to navigate the dynamic Forex market.

Read More

Forex MAJORS

Cryptocurrencies

Signatures

Best Brokers of 2025