|

AUD/USD Price Analysis: Aussie pressuring five-month highs and the 0.7000 handle

  • AUD/USD is about to end December on the high tick above the 0.7000 handle. 
  • The next resistances on the way up are seen near 0.7040 and 0.7055 price levels. 
 

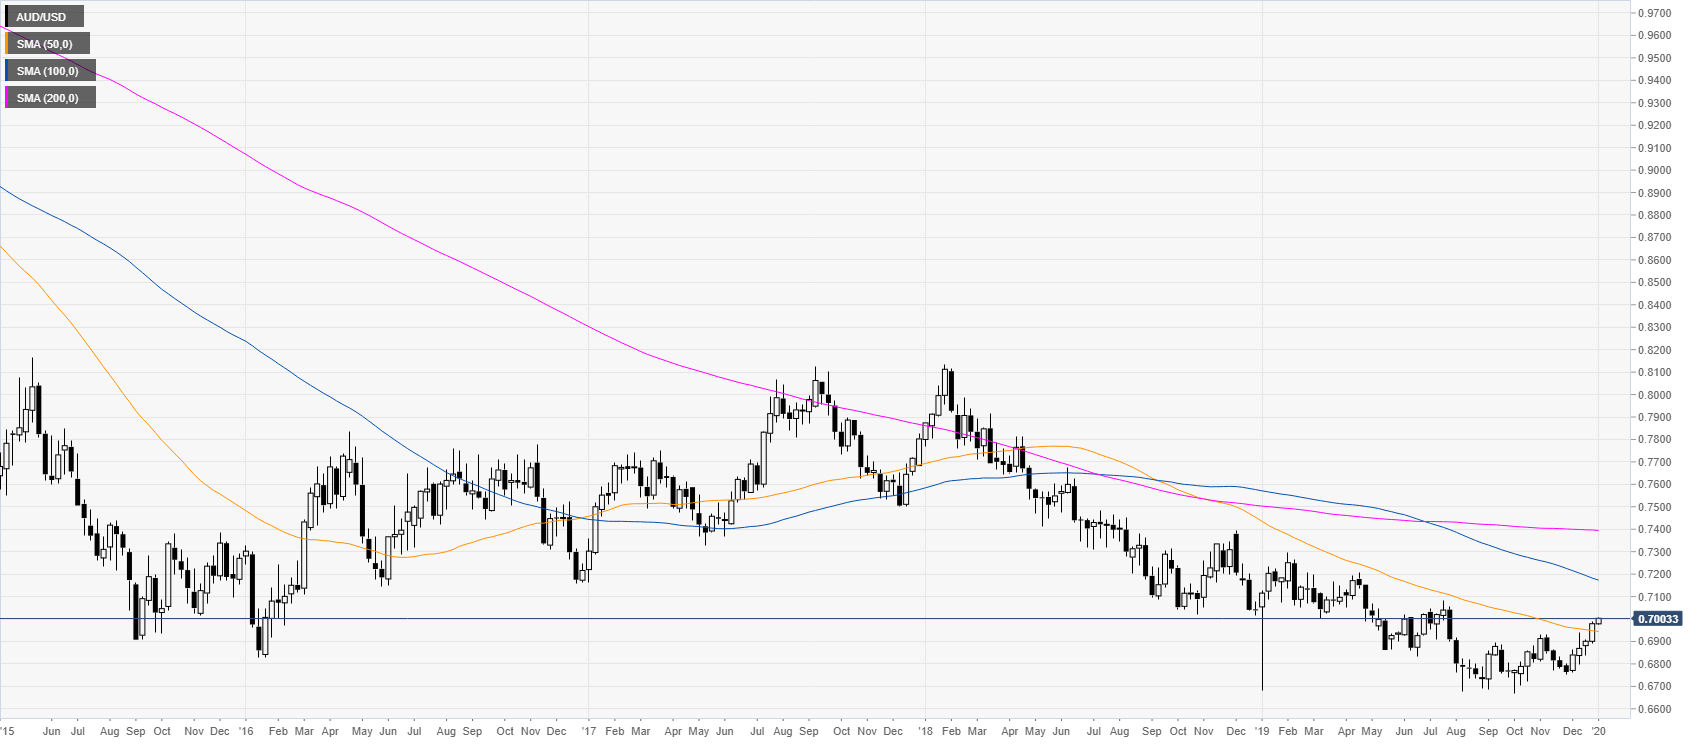
AUD/USD weekly chart

 
The aussie is about to end 2019 with a end-of-year rally above the 50-period weekly simple moving average (SMA). The spot has been under pressure in the first half of the year but from August onwards the market has started to give signs of a potential bottom. If the bulls maintain the market above the 0.6700 handle, 2020 will be sideways to up. 
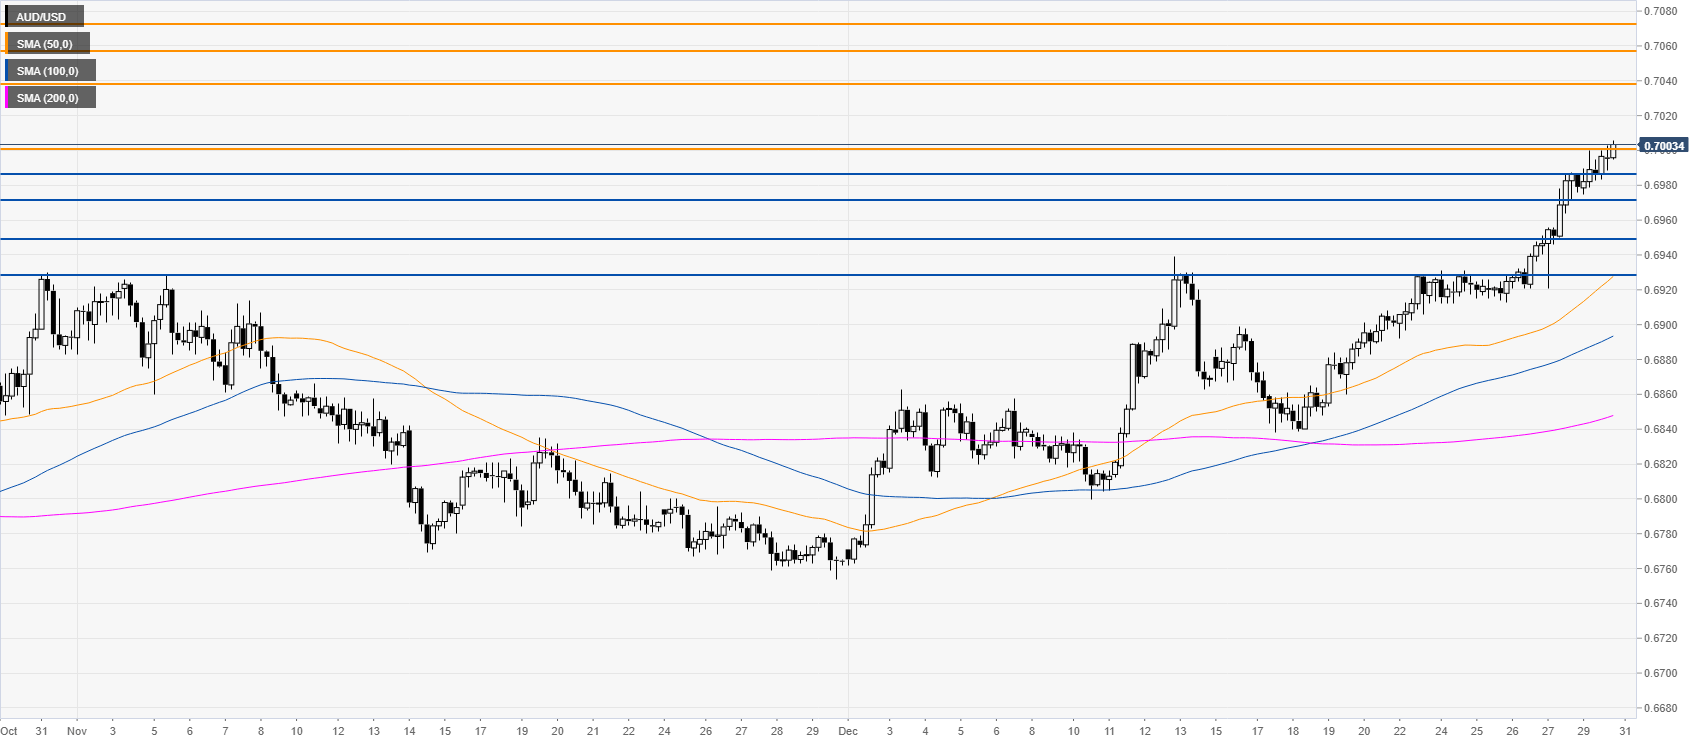
 

AUD/USD daily chart 

 
AUD/USD is challenging the 0.7000 handle while trading above the 200-day simple moving average (DMA). In 2020, bulls will likely try to reach the 0.7100, 0.7200 and 0.7300 handle on the way up. On the flip side, a successful break below the 0.6700 figure could be seen as a bearish continuation. 


AUD/USD four-hour chart

 
The market is spiking up while above the main SMAs. As the bulls are pressuring the 0.7000 figure the market is set to climb towards 0.7040, 0.7055 and 0.7072, according to the Technical Confluences Indicator. Support can be found at 0.6985, 0.6967, 0.6952 and 0.6930 price levels.
   

Additional key levels

AUD/USD

Overview
Today last price0.7003
Today Daily Change0.0024
Today Daily Change %0.34
Today daily open0.6979
 
Trends
Daily SMA200.6879
Daily SMA500.6853
Daily SMA1000.6816
Daily SMA2000.6901
 
Levels
Previous Daily High0.6987
Previous Daily Low0.6921
Previous Weekly High0.6987
Previous Weekly Low0.6892
Previous Monthly High0.6929
Previous Monthly Low0.6754
Daily Fibonacci 38.2%0.6962
Daily Fibonacci 61.8%0.6946
Daily Pivot Point S10.6938
Daily Pivot Point S20.6896
Daily Pivot Point S30.6871
Daily Pivot Point R10.7004
Daily Pivot Point R20.7029
Daily Pivot Point R30.707

Author

Flavio Tosti

Flavio Tosti

Independent Analyst


More from Flavio Tosti
Share:

Editor's Picks

EUR/USD treads water above 1.1850 amid thin trading

EUR/USD stays defensive but holds 1.1850 amid quiet markets in the European hours on Monday.  The US Dollar is struggling for direction due to thin liquidity conditions as US markets are closed in observance of Presidents' Day. 

GBP/USD flat lines as traders await key UK and US macro data

GBP/USD kicks off a new week on a subdued note and oscillates in a narrow range near 1.365 in Monday's European trading. The mixed fundamental backdrop warrants some caution for aggressive traders as the market focus now shifts to this week's important releases from the UK and the US.

Gold sticks to intraday losses; lacks follow-through

Gold remains depressed through the early European session on Monday, though it has managed to rebound from the daily trough and currently trades around the $5,000 psychological mark. Moreover, a combination of supporting factors warrants some caution for aggressive bearish traders, and before positioning for deeper losses.

Bitcoin, Ethereum and Ripple consolidate within key ranges as selling pressure eases

Bitcoin and Ethereum prices have been trading sideways within key ranges following the massive correction. Meanwhile, XRP recovers slightly, breaking above the key resistance zone. The top three cryptocurrencies hint at a potential short-term recovery, with momentum indicators showing fading bearish signs.

Global inflation watch: Signs of cooling services inflation

Realized inflation landed close to expectations in January, as negative base effects weighed on the annual rates. Remaining sticky inflation is largely explained by services, while tariff-driven goods inflation remains limited even in the US.

Ripple Price Forecast: XRP potential bottom could be in sight

Ripple edges up above the intraday low of $1.35 at the time of writing on Friday amid mixed price actions across the crypto market. The remittance token failed to hold support at $1.40 the previous day, reflecting risk-off sentiment amid a decline in retail and institutional sentiment.